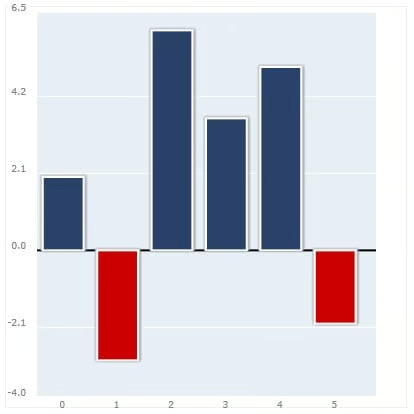
Welcome to the conclusion of the Create a Win/Loss Chart with PlotKit article. In that tutorial, we differentiated our Win/Loss chart from one in which the value of each column is either 1 or -1, where 1 denotes a win and -1 a loss. Ours more closely resembled a positive & negative bar chart, whereby each bar could have a different numeric value, but all extend from the zero axis.
To create our new chart type, we had to modify a few of the PlotKit .js files. So far, we’ve modified the Layout.js and Canvas.js files. Today, we’re going to work in the SweetCanvas.js code. Finally, I’ll show you how to dynamically calculate your own yTicks so that they cross the zero Y point.
The _renderWinLossChart() Method
This is arguably the most important method of all because it’s where the rubber hits the road, so to speak. I included the entire method, although there are really only a few changes. The most notable one is the chooseColor() method; ours utilizes the appropriate color based on the selected color scheme for positive values and a reddish color for negative ones. I say reddish because the actual color is slightly darker than true red:
PlotKit.SweetCanvasRenderer.prototype._renderWinLossChart = function() {
  var bind = MochiKit.Base.bind;
  var shadowColor = Color.blackColor().colorWithAlpha(0.1).toRGBString();

  var prepareFakeShadow = function(context, x, y, w, h) {
      context.fillStyle = shadowColor;
      context.fillRect(x-2, y-2, w+4, h+2);
      context.fillStyle = shadowColor;
      context.fillRect(x-1, y-1, w+2, h+1);
  };

  var colorCount = this.options.colorScheme.length;
  var colorScheme =  this.options.colorScheme;
  var setNames = PlotKit.Base.keys(this.layout.datasets);
  var setCount = setNames.length;
  var bars = this.layout.bars;
  var chooseColor = function(name) {
      return name == 'win' ? colorScheme[0] : Color.fromHexString('#CC0000');
  };

  var drawRect = function(context, bar) {
      var x = this.area.w * bar.x + this.area.x;
      var y = this.area.h * bar.y + this.area.y;
      var w = this.area.w * bar.w;
      var h = this.area.h * bar.h;

      if ((w < 1) || (h < 1))
          return;

      context.save();

      context.shadowBlur = 5.0;
      context.shadowColor = Color.fromHexString("#888888").toRGBString();

      if (this.isIE) {
          context.save();
          context.fillStyle = "#cccccc";
          context.fillRect(x-2, y-2, w+4, h+2);
          context.restore();
      }
      else {
          prepareFakeShadow(context, x, y, w, h);
      }
      if (this.options.shouldFill) {
          context.fillStyle = chooseColor(bar.name).toRGBString();
          context.fillRect(x, y, w, h);
      }

      context.shadowBlur = 0;
      context.strokeStyle = Color.whiteColor().toRGBString();
      context.lineWidth = 2.0;

      if (this.options.shouldStroke) {
          context.strokeRect(x, y, w, h);
      }

      context.restore();

  };
  this._renderBarChartWrap(this.layout.bars, bind(drawRect, this));
};
The _renderBackground() Method
Our chart style must be appended to the array literal that is passed to the findValue() method in order to be rendered:
PlotKit.SweetCanvasRenderer.prototype._renderBackground = function() {
    var context = this.element.getContext("2d");

    if (findValue(["bar","line","win/loss"], this.layout.style) > -1) {
        context.save();
    ...
A little further down in the same method, there is some extra code to draw the zero yTick in black and twice as thick as the others. While this is certainly not crucial to making the chart work, I like for the zero axis to stand out:
  for (var i = 0; i < ticks.length; i++) {
    var x1 = 0;
    var y1 = 0;
    var x2 = 0;
    var y2 = 0;
    //draw the zero yTick in black
    if (i > 0 && parseFloat(ticks[i][1].replace(/[^0-9-.]/g, '')) == 0.0) {
      context.strokeStyle = Color.blackColor().toRGBString();
      context.lineWidth   = 2.0;
    }
    else {
      context.strokeStyle = this.options.axisLineColor.toRGBString();
      context.lineWidth   = 1.0;
    }
    ...
Note that, in order for this code to take effect, you need to include a zero value in the layout.yticks array. It’s OK to let PlotKit guestimate the yTicks for you, but you also need to adjust them so that one of them falls exactly on 0.0. First, add your dataset and call evaluate(). That will cause PlotKit to calculate the yTicks, whereby each point is represented by a two-dimensional array. The first value ranges from one to zero and tells the renderer where to draw the point on the Y axis. The second value is the numeric label value:
values = [[0, 2], [1, -3], [2, 6], [3, 3.6], [4, 5], [5, -2]];
layout.addDataset("data", values);

// update
layout.evaluate();

//PlotKit calculates the following five yTick values:
//[1,-4.0][0.8,-1.9][0.6,0.2][0.3999999999999999,2.3][0.19999999999999995,4.4][0,6.5]
Now our job is to iterate over each point and choose the closest one to zero. The difference between it and the zero point is stored:
var zeroVal = Math.abs(parseFloat(layout.yticks[0][1])), nextVal, diff;
for (var yTick=1; yTick < layout.yticks.length || nextVal >= zeroVal; yTick++) {
  nextVal = Math.abs(parseFloat(layout.yticks[yTick][1]));
  if (nextVal < zeroVal ) {
    diff    = 0 - parseFloat(layout.yticks[yTick][1]);
    zeroVal = nextVal;
  }
  else {
    break;
  }
}
The last step is to iterate through each yTick and move them by the difference that we calculated above:
for (var yTick=1; yTick < layout.yticks.length-1; yTick++) {
  layout.yticks[yTick][1] = (parseFloat(layout.yticks[yTick][1]) + diff).toFixed(layout.options.yTickPrecision);
  layout.yticks[yTick][0] -= diff * layout.yscale;
}

renderer.clear();
renderer.render();