


In business applications, dashboards provide at-a-glance views of Key Performance Indicators (KPIs) relevant to a particular objective or process. As business services have moved to the Cloud, so too have dashboards. Web-based dashboards can draw their data from a number of sources, from databases, feeds, other sites, and can refresh parts of the page at various intervals so that their contents are always relevant and up-to-date. Although many Cloud services provide their own customizable dashboards, you may also have to build your own to summarize data that is more specific to your particular enterprise. As we’ll see here today, building your own dashboard is not that difficult. It’s all about matching your needs to the right tools and/or technologies.
What Should My Web Dashboard Look Like?
Since Web Dashboards contain a lot of high-level facts and figures, components should contain nice bold fonts as well as charts and graphs. The use of color helps distinguish components from each other.
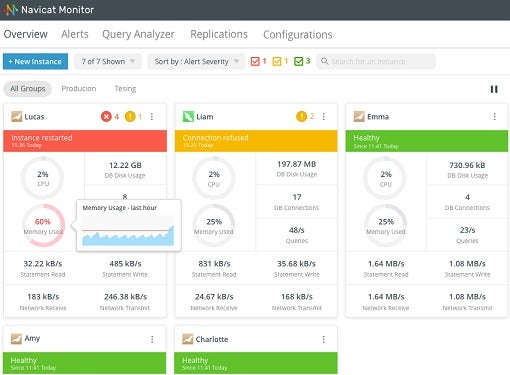
To illustrate, here are a couple of example dashboards. First, the dashboard from the Navicat Monitor, which is a web-based database monitoring tool:
Next, here’s a website that I enjoy called vipfaq. It shows all sorts of stats about so-called celebrities, like me!? What I like about this particular dashboard is that the boxes can be rearranged via drag & drop.
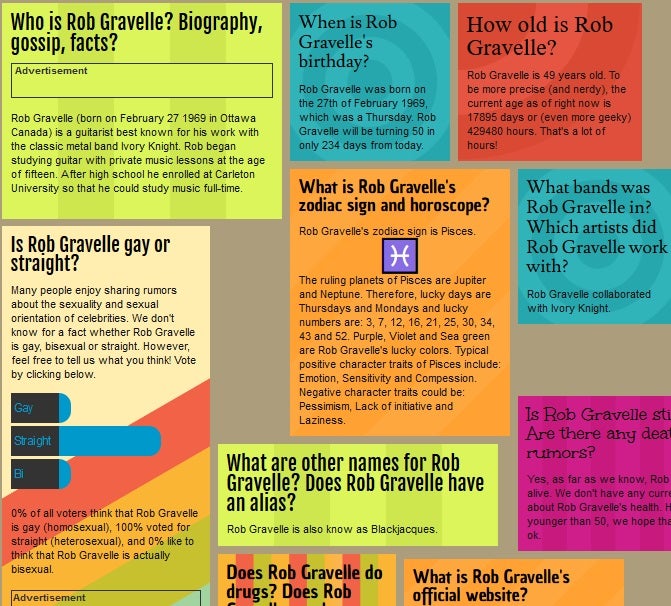
It’s good to know that I am still alive and kicking, although it does seem to focus mostly on my guitar-playing alter ego!
If you’d like to see more examples of Web Dashboards, here‘s a site that shows many of the best — at least as of June 2013.
What Are the Best Frameworks/Libraries for Building Web Dashboards?
As you can imagine, a web dashboard is comprised of many components. Not only are there potentially many individual sections to contend with, but each of these may be populated using different data stores and transport methods. For instance, one chart’s data may be supplied by a public jsonp service, while another might employ page scraping to obtain its data. A dashboard that integrates data from a number of hosts won’t be able to rely on straight Ajax due to cross-domain restrictions. Therefore, a server-side technology may also have to be utilized.
Let’s focus on JavaScript-driven frameworks for now. These include:
In fact, best results are often achieved using a combination of frameworks (React/Flux, d3 and Browserify) instead of relying too heavily on a single one (like Angular).
React is a good choice for front-end concerns as it will handle all DOM manipulation, plus it’s fun to use!
D3 is really adept for drawing charts and maps that have a lot of interactivity and fancy transitions. It works nicely with React and can perform a variety of math operations as well.
You will also need to manipulate data on the client-side, so you can have smooth interactions, especially if you update DOM elements in real-time or employ complex API calls. There are several good solutions to choose from; I will present some of them here.
Having worked with Angular for a few years now, I have found a few issues that make me hesitant to recommend it. For starters, once you get past the very basics, the learning curve gets significantly steeper. Moreover, the framework is not very flexible as it forces your apps to follow the MVC architectural structure. IMHO, this can be overkill in some cases. Having said that, if you already have lots of experience with Angular, you can achieve very good results with it. In fact, I have found that a lot of companies use it on their sites and services.
Both React and D3 offer a plethora of components, so you are better positioned to focus on the logic of the data flow rather than learning all of the nuts and bolts of the framework. For the data manipulation, you can’t go wrong with Flux; it was specifically designed to bind with React. It is quite easy to use from day one and powerful to boot. Its concepts are plain and simple: you have stores that store data and listeners that listen for changes. You can also use the awesome Reflux library to make it even easier!
You may also want to try developing with Browserify. It’s really great. You can use all the Node syntax and most of the npm libs on the client-side and it will just compile to the client. The Browserify-test framework works great. You just have to set up some npm tasks and it really allows you to organize your code as you want and not worry too much about efficiency while prototyping.
Going Forward
In the next few tutorials, we’ll work with some of the aforementioned frameworks and libraries to create some custom dashboards.
