


Most people are familiar with working with images on their web pages. Images can easily be presented using the HTML IMG tag. One of the issues, however, with images is that when you try to scale the page or display it on different devices, the image can become dithered or malformed. One solution to avoiding malformed or dithered images is to use scalable vector graphics (SVG) instead.
SVG images differ from standard images files I that they describe the overall shape instead of describing each pixel of an image. Instead of the pixels, images tend to be described as a set of lies and curves. This allows the image to be created regardless of the resolution and device being used. Unlike a normal image file, as an SVG image size changes, the it should remain clear.
Creating an SVG Image
There are tools that will allow you to create an SVG image. There are also tools and sites that will help you convert a normal image to an SVG image. For those that like to get into the details of using a technology, you can hand code SVG elements to create your own pictures.
Some of the basic shapes you can use in your HTML include:
- Circle
- Ellipse
- Line
- Polyline
- Polygon
- Rectangle
Each of the elements above can also be created using the SVG path element. The path element provides a more free-form approach to drawing an image, and thus can also be used for more complex graphics as well.
If you are using a browser that supports HTML5, then you can embed these shapes directly into your web pages. Additionally, you can include attributes for describing the stroke to be used, whether the shape should be filled, colors, and more.
To use the SVG element, you will need one of the following browser versions. Note that other browsers might also support SVG.
- Google Chrome 4.0 or later
- Internet Explorer 9.0 or later
- Mozilla Firefox 3.0 or later
- Safari 3.2 or later
- Opera 10.1 or later
Using the SVG Tag
To include SVG graphics on your page, you embed an SVG tag directly into your HTML code. As expected, this tag is .
Like a canvas element, which can also be used for including graphics on a page, with an SVG element you define a width and height for a work area size that will contain your SVG graphics. Listing 1 shows the code for a svg element that displays a simple circle.
Listing 1: Using the
<html>
<body>
  <h1>Simple SVG example</h1>
  <svg width="200" height="200">
  <circle cx="100" cy="100" r="90" stroke="blue" stroke-width="5" fill="yellow" />
  </svg>
</body>
</html>
The output of this listing is:
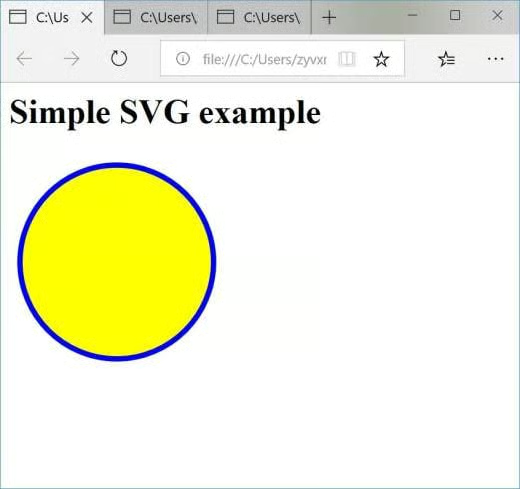
As you can see in the listing, the SVG work area is set up that is 200 by 200 pixels in size. A circle with a radius of 90 centered at an x,y coordinate of 100,100 is then drawn with a blue line and filled with yellow. While a circle was drawn in this listing, other shapes could have also been included between the opening and closing svg tags.
Creating a Line Using SVG
With a svg tag in place within your HTML code, you are ready to start drawing shapes. A line is a simple shape that only requires a starting point and ending point. You can also include values to define the width and color of a line. The basic attributes for a line are:
x1 - The starting x coordinate of the line
	y1 - The starting y coordinate of the line
	x2 - The ending x coordinate of the line
	y2 - The ending y coordinate of the line
	style - The markup for the line including:
		stroke - for the color of the line
		stroke-width – for the width of the line
Listing 2 contains an example of drawing simple lines. Three different lines are drawn with different color and different thicknesses.
Listing 2: How to draw a simple svg line
<html>
<body>
<h1>Simple SVG line example</h1>
<svg width="300" height="200">
  <line x1="10" y1="10" x2="100" y2="100" style="stroke:green;stroke-width:10" />
  <line x1="100" y1="10" x2="200" y2="100" style="stroke:red;stroke-width:5" />
  <line x1="200" y1="10" x2="300" y2="100" style="stroke:blue;stroke-width:1" />
</svg>
</body>
</html>
The output of listing 2 is:
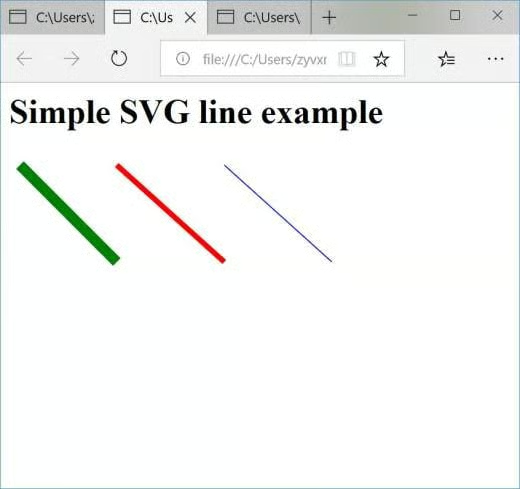
In Listing 2, you can see that a svg element is added that contains lines that will be drawn. In this case, the SVG work area is 300 by 200 pixels. If the size of the svg element is smaller than what is needed to hold the lines, then the lines will be truncated.
In Listing 2, you can see that three lines are drawn using line elements. Each line is shifted along the x-axis by using a larger value for the x1 coordinate each time. The ending points are adjusted in the same manner thus making the lines parallel. In each of the three lines, you can see that the color was set to a different value by changing what is included after “stroke:”. Additionally, the widths of the lines were differed from 10 to 5 by changing the value after “stroke-width”. You can play with the listing to change the values of the lines to get different results.
It is worth noting that word values were used for the color of each of the lines. You can also use RGB (red, green, blue) values to set the color. You do this by replacing the color names with a call to RGB(). For example, instead of red, you could have used stroke:rgb(255,0,0);.
Creating an SVG PolyLine
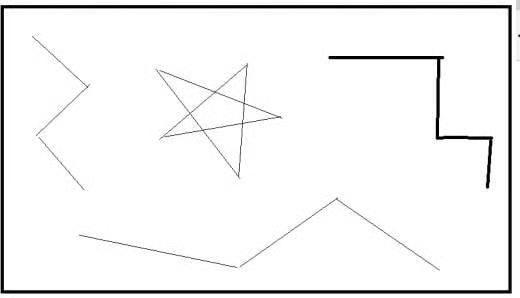
A polyline is a shape that is created by using straight lines that are connected to each other. It would operate similarly to a regular line except that you’d be able to extend the line by adding another point. The following show examples of polylines:
To create SVG polylines, you use the polyline element and pass it point coordinates. In addition to the points, you can also pass style information like you did with the regular line. Listing 3 contains an example of a polyline being drawn on a page.
Listing 3: Drawing a polyline
<html>
<body>
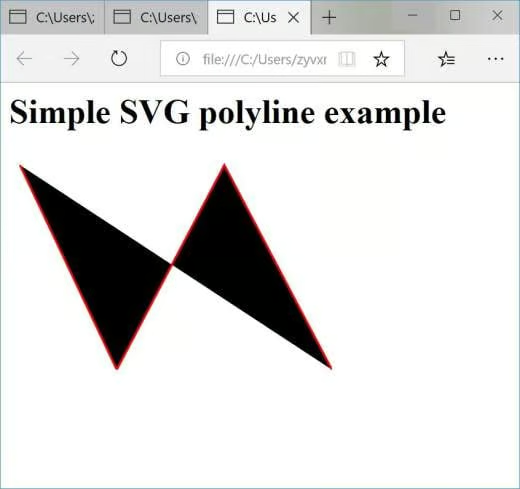
<h1>Simple SVG polyline example</h1>
<svg width="300" height="200">
<polyline points="10,10 100,200 200,10 300,200"
style="fill:none; stroke:red; stroke-width:2" />
</svg>
</body>
</html>The rendered page should look like the following:
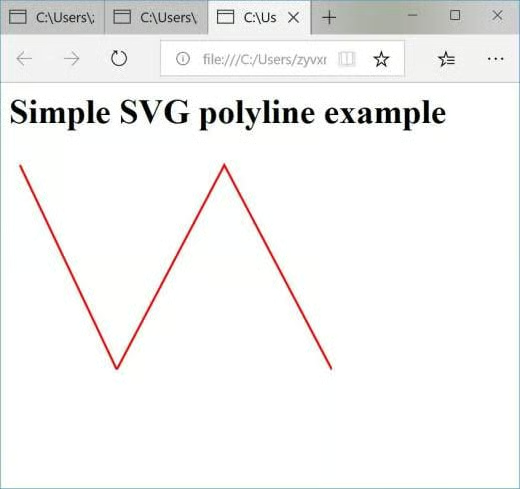
As you can see in listing 3, each point of the polyline is separated by a space. You can add additional points, but you’ll want them to remain within the SVG work area. If you create a point that has an x coordinate value greater than 300 or a y coordinate greater than 200, you’ll be trying to draw outside of the SVG area, and the line will be cut off.
In looking at listing 3, you should have noticed that one additional value was also passed into the style string. You’ll see that the value of “fill:none;” was included. A regular line element has no way to be filled because it is flat. Once you create a more than one segment, then it is possible that there will be an area between the two lines that could be filled. If you remove “fill:none” from listing 3 and render the page again, the output will look like the following:
As you can see in the image, the spaces between the lines are filled by default. You can also change the value of fill to a color such as green:
<polyline points="10,10 100,200 200,10 300,200"
    style="fill:green; stroke:red; stroke-width:2" />
The result would be similar to the previous image, except the black would be green!
Including External SVG Markup
You can also include an external SVG file. An SVG file is simply XML, so the content of an SVG file is easy to read. Listing 4 shows the SVG markup that was presented in listing 3, but with a green fill. Such content can be saved in a file with a .svg extension.
Listing 4: Contents of an .svg file
<svg width="300" height="200" >
   <polyline points="10,10 100,200 200,10 300,200 "
    style="fill:green; stroke:red; stroke-width:2" />
</svg>
The only real difference in this code from what was in Listing 3 is the addition of the namespace in the first line for identifying that this is SVG code. This listing does include the ‘green’ fill that was mentioned earlier.
To use the .svg file, the easiest manner is to use an embed element in your HTML code as shown in Listing 5.
Listing 5: Embedding SVG code
<html>
<body>
  <h1>Simple SVG polyline example</h1>
  <embed src="svgfile.svg" />
</body>
</html>
When you run Listing 5, if you named your SVG file from Listing 4 as svgfile.svg, then the result is the same as what was shown after listing 3, but with green instead of black!
In Conclusion
In this article, you have been introduced to SVG graphics. You’ve seen the line and polyline elements in action. In a future article, I’ll show you some of the other SVG graphic elements such as the circle and rectangle. It is by combining the various SVG shapes that you’ll be able to create pretty complex and interesting pictures.
