The Generate a Bar Chart with D3.js tutorial showcased d3.js’s SVG capabilities by producing a stunning bar chart with a relatively small amount of code. Although not readily apparent when working with SVG, D3 shares a lot of similarities with jQuery, and also supports much of the same event handling model. As such, we can bind an event listener to any DOM element using the d3.selection.on() method. In today’s article, we’ll use it to add custom tooltips to the bar chart that we generated in the last tutorial.
Before moving on to the d3.selection.on() method, it should be noted that you don’t need to employ an event handler to show tooltips in SVG content. The most basic method for displaying data within a D3.js chart, or any other SVG content for that matter, is to use the title tag. In SVG, it’s called “svg:title”. To add a tooltip to the bars of the last tutorial‘s chart, we merely need to append the “svg:title” element and assign the text to it:
g.selectAll(".bar")
.append("svg:title")
.text(function(d) { return d.count; });
The result is that, when the mousepointer is hovered over a particular bar, the movie count for that bar will appear in a simple white bordered box. Here’s a screenshot of the Codepen demo:
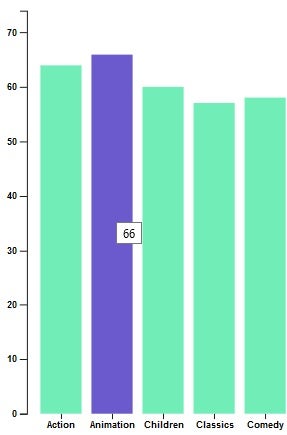
While the “svg:title” is easy to use, it’s also somewhat underwhelming compared to the rest of the graphics. Moreover, they can’t be styled, so a white box is what you get.
To create a tooltip with more visual flair, we can roll our own by binding event handlers to the bars’ “mouseover” and “mouseout” events and show a DIV at the position of the event. That might sound a bit complicated, but it’s really fairly simple. In fact, it’s as easy as 1-2-3!
1. Declare the DIV Tag in the HTML
There is some difference of opinion whether it’s best to take a declarative approach as we are doing here, or to dynamically generate the DIV element at runtime. To me, it’s six of one, half a dozen of the other. I personally like to keep my code as succinct as possible, so the declarative route wins by a hair.
<svg width="1000" height="500"></svg>
<div class="tooltip"></div>
2. Define a CSS Rule
Again, all of these styles could be set at runtime, but I feel that styling should go in a stylesheet if at all possible – especially when there are as many attributes to set as this!
div.tooltip {
    position: absolute;
    text-align: center;
    line-height: 28px !important;
    width: 60px;
    height: 28px;
    padding: 2px;
    font: 12px sans-serif;
    font-weight: bold;
    background: lightsteelblue;
    border: 0px;
    border-radius: 8px;
    pointer-events: none;
    opacity: 0;
}
3. Bind the Event Handlers
Attaching event handlers in D3 couldn’t be easier; just treat the on() method like attr() and tack it on the rect element’s chained method calls:
g.selectAll(".bar")
.data(data)
.enter().append("rect")
.attr("class", "bar")
.attr("x", d => x(d.genre))
.attr("y", d => y(d.count))
.attr("width", x.bandwidth())
.attr("height", d => height - y(d.count))
.on("mouseover", d => {
})
.on("mouseout", d => {
});
We’ll need two handlers – one for when the mouse enters the rect area and another for the mouse leaving the rect.
The Onmouseover Event
While we’re going through the trouble of spiffing up our tooltips, we might as well provide some data that’s a bit more difficult to deduce just by looking at the chart. With that in mind, let’s show what percentage of movies a bar represents. That figure is calculated by dividing the category’s movie count by the total number of movies. D3 can help us with every step of this process. For starters, we can use the D3.sum() method to add up all of the counts in the RECORDS array.
The d3.json() method retrieves the data in this format:
{
  "RECORDS": [
      {
        "genre": "Action",
        "count": "64"
      },
      {
        "genre": "Animation",
        "count": "66"
      },
      {
        "genre": "Children",
        "count": "60"
      },
 ...
D3.sum() takes an array and returns the sum (total) of each element’s value. It doesn’t work on objects, so we need to map the counts into an array first:
d3.json("https://codepen.io/blackjacques/pen/YJNqyG.html").then( data => {
  data = data.RECORDS;
  const totalMovies = d3.sum(data.map(n => n.count));
In the onmouseover handler, we can divide the data’s count by the total movies that we determined above:
.on("mouseover", d => {
tooltip.html(d3.format(".1%")(d.count/totalMovies))
.style("left", (d3.event.pageX) + "px")
.style("top", (d3.event.pageY - 32) + "px")
.transition()
.duration(200)
.style("opacity", .9)
})
The d3.format() method in front of the percentage converts the resulting figure into a percentage with one decimal point of precision, so that 0.0956556 becomes “5.6%”.
The Onmouseout Event
In the onmouseout handler, we simnply set the opacity back to zero. The transition() and duration(500) adds a half-a-second transition:
.on("mouseout", (d, i, bars) => {
    tooltip.transition().duration(500).style("opacity", 0);
});
Here’s our tooltip in action in Codepen:
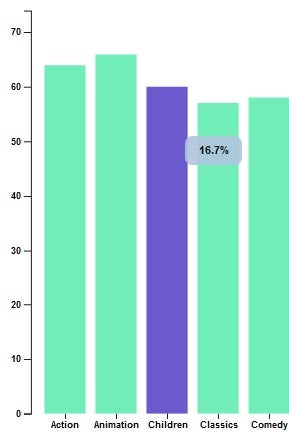
The demo includes a few extra bells and whistles, including:
- Bars that change color on mouseover.
- Counts above each bar.
- Different colors for the minimum and maximum value bars.
Conclusion
The more you explore the D3 library, the more cool things you’ll find! To get a better idea what D3 can do, I would suggest that you visit D3’s creator’s blocks page.