There is a tremendous need for data visualization using charts and graphs on the Web; think finances, statistics, sports scores. Really the list is virtually endless. While the D3.js library is capable of much more, it is a combination of data, based graphics generation, interactions, and DOM manipulation makes it the ideal tool for generating charts.
In Bring your Data to Life with D3.js, we used the D3.js library to display the contents of a CSV data file within a dynamically generated HTML table. This time around, we’re going to step things up a notch by producing a slick SVG bar chart from a JSON data set.
The Data
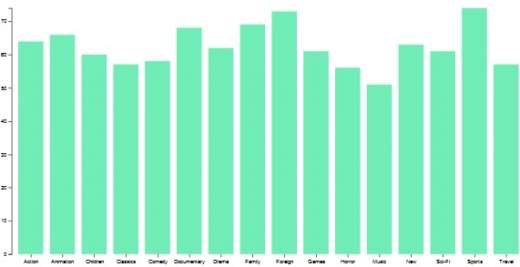
As in the last article, our data will be derived from the Sakila Sample Database, which houses the data of a fictional DVD rental store, and includes tables for films, actors, stores, and rentals. Our specific dataset is an array of objects summarizing the number of movies in each genre. Hence, each bar in the chart will represent a movie genre, with its height representing the number of movies for that particular genre:
{
"RECORDS": [
{
"genre": "Action",
"count": "64"
},
{
"genre": "Animation",
"count": "66"
},
{
"genre": "Children",
"count": "60"
},
{
"genre": "Classics",
"count": "57"
},
{
"genre": "Comedy",
"count": "58"
},
{
"genre": "Documentary",
"count": "68"
},
{
"genre": "Drama",
"count": "62"
},
{
"genre": "Family",
"count": "69"
},
{
"genre": "Foreign",
"count": "73"
},
{
"genre": "Games",
"count": "61"
},
{
"genre": "Horror",
"count": "56"
},
{
"genre": "Music",
"count": "51"
},
{
"genre": "New",
"count": "63"
},
{
"genre": "Sci-Fi",
"count": "61"
},
{
"genre": "Sports",
"count": "74"
},
{
"genre": "Travel",
"count": "57"
}
]
}
The Basic HTML
Here is all of the markup that we need to lay the ground work for our chart. In fact, it’s more than we need, because the babel script is only there to allow for ES6 constructs, including arrow functions, constants, and backticks.
<!DOCTYPE html>
<meta charset="utf-8">
<svg width="1000" height="500"></svg>
<script src="https://d3js.org/d3.v5.min.js"></script>
<script src="https://cdnjs.cloudflare.com/ajax/libs/babel-standalone/6.25.0/babel.min.js"></script>
<script>
</script>
Setting the Stage
The next step is to set some constants that we’ll be referring to later. These reference the SVG element, format the overall chart size and margins, as well as define the chart axes and <g> element. The SVG <g> element is used to group SVG shapes together. Once grouped, you can transform the whole group of shapes as if it was a single shape. This is advantageous to a nested <svg> element, which cannot be the target of transformation by itself.
const svg = d3.select("svg"),
margin = {top: 20, right: 20, bottom: 30, left: 40},
width = +svg.attr("width") - margin.left - margin.right,
height = +svg.attr("height") - margin.top - margin.bottom,
x = d3.scaleBand().rangeRound([0, width]).padding(0.2),
y = d3.scaleLinear().rangeRound([height, 0]),
g = svg.append("g")
.attr("transform", `translate(${margin.left},${margin.top})`)
In the above code, we’re using a few D3 methods that bear explaining. The d3.scaleBand() method creates a scale with a continuous and numeric output range. Output values are automatically computed by the scale by dividing the continuous range into uniform bands. Meanwhile, d3.scaleLinear() constructs a continuous scale using input between a two number domain pair and maps it to output between the two number range. Thus, linear scales preserve proportional differences.
Chaining the scale method to rangeRound() rounds all values output by the scale to the nearest whole number, which is what we want here, since there are no fractions of movies. The function accepts the min and max values which define the range.
On the x axis, the padding method sets the spacing between each bar in the chart; the larger the value, the more space between the bars.
Drawing the Chart
D3 has several methods to load different data formats, including for JSON. The json() method returns a promise so that you can process the data. In our case, the data array is stored in an object whose key is RECORDS.
Once we have the data, we can map the x and y axes to each data object’s values. The x axis is set to each genre, while the y axis ranges from zero to the maximum count within the data set:
d3.json("movies.json").then( data => {
data = data.RECORDS;

x.domain(data.map(d => d.genre));
y.domain([0, d3.max(data, d => d.count)]);

g.append("g")
.attr("class", "axis axis-x")
.attr("transform", `translate(0,${height})`)
.call(d3.axisBottom(x));

g.append("g")
.attr("class", "axis axis-y")
.call(d3.axisLeft(y).ticks(10));
});
Generating the Bars
Now we’re ready to bind the data to the bars. In this case, we have to perform the following steps:
- selectAll() “.bar” elements
- bind the data
- select the virtual .enter() selection
- append the SVG rect elements
- set the rect elements’ attributes
g.selectAll(".bar")
.data(data)
.enter().append("rect")
.attr("class", "bar")
.attr("x", d => x(d.genre))
.attr("y", d => y(d.count))
.attr("width", x.bandwidth())
.attr("height", d => height - y(d.count));
You can peruse the demo of the bar chart, along with its source code, on Codepen.
Here’s a screenshot:
Coming up Next…
While trying out the demo, you’ll notice that hovering the mousepointer over a bar changes its color. That’s thanks to the css :hover pseudo selector. In the next tutorial, we’ll learn how to attach handlers to the mouseover and mouseout events to display additional information.