If you are a front-end developer or any developer for that matter, chances are you have at least heard of React – one of the hottest JavaScript frameworks at the moment. And in my opinion all its fan following is justified given the powerful features it offers.
Many organizations are choosing React over Angular nowadays for building their web applications. If you are new to React and want to understand the power of React’s virtual DOM, do check out this answer on StackOverflow which explores this topic in good detail.
So in this tutorial we are going to make beautiful charts using React. For JavaScript charts are going to rely on FusionCharts and its React charts plugin.
This is what we will be making today (live version available here):
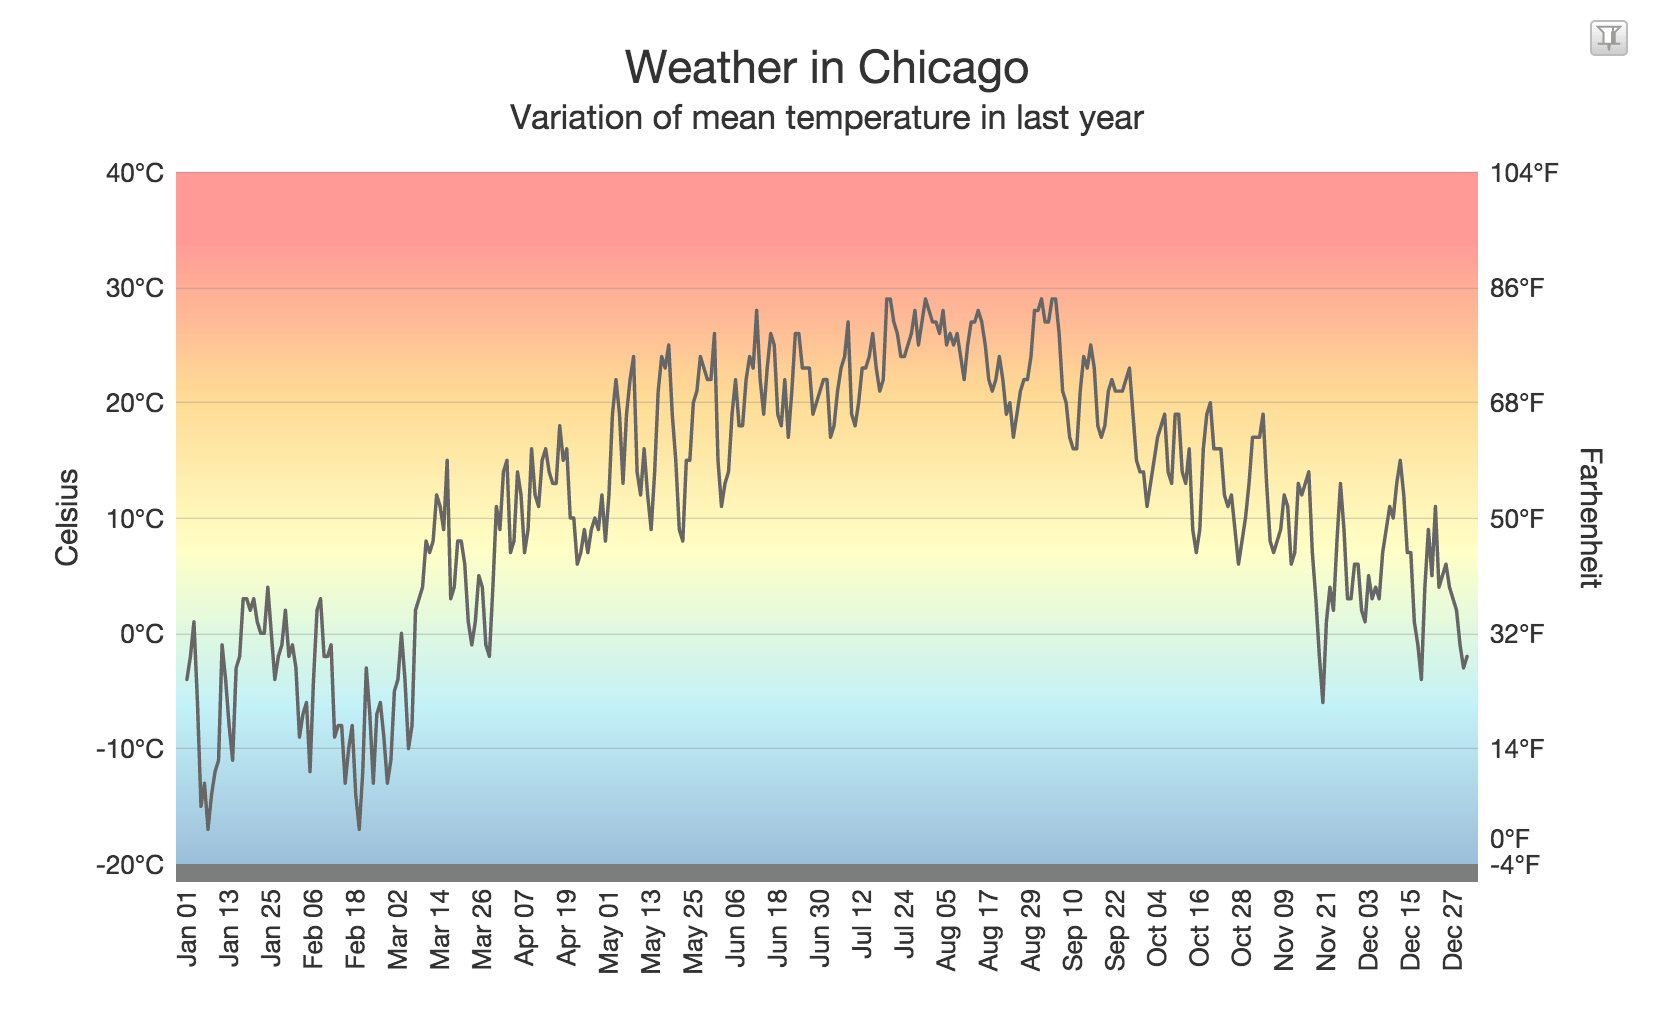
It is a zoom-line chart, which is the perfect way to plot large data sets. Although the data I am plotting is only for a year, you can use it plot thousands of data points spanning tens of years.
Now let’s get started!
Step 1: Importing Scripts
In the first step of our project, we are going to import all the scripts that our application depends on:
- React with add-ons
- JSX Transformer
- FusionCharts’ main package files
- FusionCharts’ React plugin file
And here’s how we do it:
<head>
<script src="/location/of/react-with-addons-0.14.6.js"></script>
<script src="/location/of/JSXTransformer-0.13.3.js"></script>
<script src="/location/of/fusioncharts.js"></script>
<script src="/location/of/fusioncharts.charts.js"></script>
<script src="/location/of/react-fusioncharts.min.js"></script>
</head>
Note: We have used JSX Transformer for our project, but it is not advisable to use it for production. Best practice is to pre-compile JSX and then use that for production web applications.
Step 2: Creating DOM Element
Now we will create a <div> element in our HTML page to house our chart:
<div id="react-chart">Just a moment!</div>
Step 3: Defining Chart Object
Now that all our dependencies and DOM element are in place, we will start shaping our chart by defining an object for our chart using FusionCharts constructor and pass chart options and data in it.
Here’s the syntax to do it:
FusionCharts.ready(function() {
var chartObj = {
"chart": {},
"categories": [{}],
"dataset": [{}, {}, ...]
};
});
Here is our implementation of above syntax for the chart we are plotting:
FusionCharts.ready(function() {
var weatherData = {
"chart": {
"caption": "Weather in Chicago",
"captionFontBold": "0",
},
"categories": [{
"fontColor": "#ff0000",
"category": "Jan 01|Jan 02|Jan 03| ... // more categories "
}],
"dataset": [{
"color": "666666",
"data": "-4|-2|1| ... // more data "
}, {
"parentYAxis": "S",
}]
};
});
We have used compact data mode with | as data separator, you can also use multiple key, value pair assignment style to feed data to the chart.
Step 4.1: Populating Chart Configurations
In this step, we will be preparing chart configurations for our chart which will be used by React.render() to render the chart.
Below is the syntax to do that:
var chartObjConfig = {
id: "unique chart id",
renderAt: "DOM element for chart",
type: "chart type",
width: "chart width",
height: "chart height",
dataFormat: "chart data format",
dataSource: chartObj
};
Here’s how we do it for our chart:
var weatherChartConfigs = {
  id: "weather-chart",
  renderAt: "react-chart",
  type: "zoomlinedy",
  width: "100%",
  height: "500",
  dataFormat: "json",
  dataSource: weatherData
};
This chart configuration will go inside chart object we created in previous step.
Step 4.2: Rendering the Chart
Now with everything in place, we just need to bring it to life by rendering it using React.render(). This is how we do it:
React.render( < react_fc.FusionCharts {...weatherChartConfigs}/>, document.getElementById('react-chart'));
As soon as you complete this step, you should see a working chart. If you got stuck anywhere, head over to this demo I made on CodePen to see the source code.
What’s Next?
The process I described above is enough to getting you started with making interactive charts in React. And to help you do more, here are few key resources:
- Make your charts look better: refer my previous article to know how to use chart attributes to improve a chart’s design.
- Plugin page: Bookmark the official React charts plugin page for future reference. It contains all the relevant resources.
- Documentation: I have only covered the basics here, but there is a lot that is possible. And you should refer these documentation pages for React and zoom-line charts to explore more.
As always, just drop a comment below if you have any questions. Happy to help!
Author bio: Vikas is a budding programmer who likes to have fun with front-end technologies. You can see some of his tiny experiments on his website. He used to work at FusionCharts and is always available for a quick chat on Twitter.