I’m currently working around the touch events of IE10 and even if I’m lucky enough to have a Windows 8 tablet, I was looking for a simpler way to do basic tests on my classical laptop without switching to the tablet each time. While looking for that, I’ve discovered several tips & tricks that may help you debugging the IE10 touch events in your code without even using a touch device. Nice side effect: the same approach will also help you to test & debug your responsive web design!
Pre-requisites: to follow this tutorial, you need first to:
As a complement resource, you may have a look to the Pointer.JS library that mimics the IE10 model for the other browsers.
The Windows 8 Simulator to simulate touch
The Windows Simulator is installed with the development tools and is normally designed to help you testing & debugging your Metro Style Apps. You may learn a bit more details here: First look at Windows Simulator
Still, nothing prevents us to use it for debugging web applications running inside IE10 in the simulator. Let me show you how.
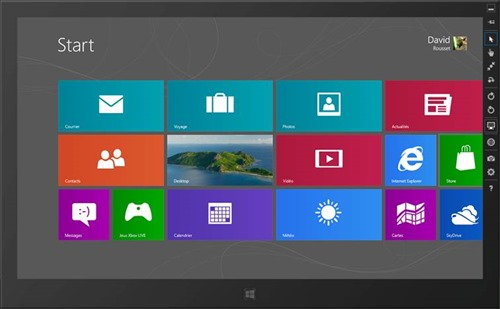
1 – Launch the simulator by launching the Microsoft.Windows.Simulator.exe located inside “Program Files (x86)Common FilesMicrosoft SharedWindows Simulator11.0”
And click on the desktop icon.
2 – Launch IE10, navigate to the “Internet Options” and “Advanced” tab. Check that both “Disable script debugging (Internet Explorer)” & “Disable script debugging (Other)” are not checked:
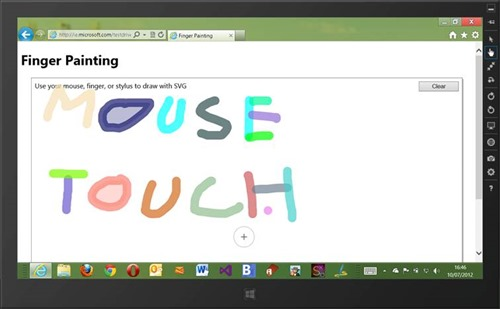
3 – Navigate to the URL you’d like to test and/or debug. For instance, let’s test this demo: Finger Painting from the IE Test Drive. Using the simulator, you can simulate classical mouse input and/or touch switching modes using this 2 buttons:
First, you’ll think you’ll get the exact same results:
But clicking on this button
will show you that you have a dual touch simulation for zooming & rotating:
These dual touch features are more interesting to use with such demos: Browser Surface
Using the simulator, you’ll be able to simulate zoom & rotation via touch gesture.
Visual Studio 2012 to debug the JavaScript code
If you’d like to go deeper in the testing & debugging of your touch experience, you’ll probably need to debug your JavaScript code. The first obvious solution is to press the F12 key to use the IE10 developer tools. But working in the smaller window of the simulator with the F12 key is not very comfortable.
Another great solution is then to use the debugger of Visual Studio 2012. Here are the steps to follow for that:
1 – On your main session (outside of the simulator), launch Visual Studio 2012 RC Express and navigate to “DEBUG” –> “Attach to Process…”
2 – Locate the “iexplorer.exe” process (of type “x86, Script”) to attach to:
3 – If everything goes fine, you should have this result using the Browser Surface demo:
If it’s not the case, you’ve probably attached to the wrong iexplore.exe process or you’ve forgot to uncheck the disable script debugging options.
If you’ve chosen the right process, you will see all the JavaScript files in the right pane named “Solution Explorer” under the node named “Script Documents”.
4 – Let’s then first concentrate our efforts on the JavaScript debugging experience. Open for instance the “demo.js” file and add a breakpoint on the line 136: if (Options.inertiaBounce()) { :
5 – Take an image and throw it using the touch simulation, it should automatically break into Visual Studio:
You can then step into the code, view the JavaScript console output, jump directly to the definition of a function by right clicking on it, etc. Well, you’ll have a very advanced debugging experience!
In conclusion, you can entirely debug your JavaScript touch logic to support IE10 without any touch device. Of course, you’ll need to test your final code & web app on a real touch device to have a perfect idea on how your code will behave in real conditions. But still, this approach could help you and save you time.
Testing & Debugging your Responsive Design
The Simulator and VS 2012 could be also some good friends to help you testing & debugging your responsive design. Let’s start by reviewing what the simulator has to offer for that.
I’ve searched on the web for the best websites implementing responsive design principles. I’ve chosen to use this one: http://garretkeizer.com/ for the following screenshots. You can find other cool websites to test on: http://mediaqueri.es
Here is the design of his website in Internet Explorer 10 using the default settings of the simulator:
Let’s now review some cool options of the simulator to go further.
1 – You can test how the design change in portrait or landscape mode by clicking on these buttons:
Here is the result for the chosen website:
2 – You can also simulate various forms factors and resolutions displays by clicking on this button:
3 – Here is the result of the same website in 2560×1440 (compared to the default 1366×768 of previous screenshots):
4 – Now if you want to go even further, you can use the awesome DOM Explorer tool of VS 2012 to help you reviewing & live editing your CSS. For instance, once the debugger is attached, you’ll see a window named “DOM Explorer”. While your mouse is hovering the HTML node, you’ll see in live the various areas highlighted in the simulator:
And of course, you’ll be able to review, edit & trace your styles in Visual Studio to potentially fix your CSS design.
I hope that these little tricks will help and save some of you time. You should then keep an eye on these free tools!
<<<>>>
Advertisement
David Rousset
David Rousset is a Developer Evangelist at Microsoft, specializing in HTML5 and web development. Read his blog on MSDN or follow him @davrous on Twitter.
This article was reprinted with permission from Microsoft Corporation. This site does business with Microsoft Corporation.
Since the Internet first broke on to the scene in the late 80s and 90s, it has undergone a couple of significant changes, encapsulated by Web 1.0 and 2.0. Now, we are entering into the third version of the Web known as Semantic Web or Web 3.0. In this web development tutorial, we will explore […]
One of the most important ways a developer can grow and learn is by interacting with other programmers. That interaction can be as simple as a conversation or as complex as collaborating on a piece of software. Even before the pandemic and the call for social distancing, developers frequently turned to online communities to troubleshoot […]
The CSS3 Template layout module is a draft module that provides a high-level view of layouts, which is needed for positioning and alignment of widgets in a graphical user interface (GUI) or the layout grid for a page. From a presentation layer standpoint, web pages contain the grid definition for the page/window, as well as […]
Digital code signing certificates are more valuable on the dark web than many other illegally traded goods, like credit card numbers, fake passports or handguns. Researchers from Venafi said these certificates routinely cost up to $1,200 on the black market. By comparison, US passports cost about $850, handguns $600 and credit cards just a few […]
The original home of HTML tutorials. HTMLGoodies is a website dedicated to publishing tutorials that cover every aspect of being a web developer. We cover programming and web development tutorials on languages and technologies such as HTML, JavaScript, and CSS. In addition, our articles cover web frameworks like Angular and React.JS, as well as popular Content Management Systems (CMS) that include WordPress, Drupal, and Joomla. Website development platforms like Shopify, Squarespace, and Wix are also featured. Topics related to solid web design and Internet Marketing also find a home on HTMLGoodies, as we discuss UX/UI Design, Search Engine Optimization (SEO), and web dev best practices.
Advertiser Disclosure: Some of the products that appear on
this site are from companies from which TechnologyAdvice
receives compensation. This compensation may impact how and
where products appear on this site including, for example,
the order in which they appear. TechnologyAdvice does not
include all companies or all types of products available in
the marketplace.


