


You have probably heard of Web Vitals at some point in your life as a developer. Delivering a good user experience on the web is no trivial task, especially considering all of the major factors that need to be addressed for that to occur. This includes things such as website performance, accessibility, search engine optimization (SEO), Progressive Web Apps (PWA) design, and so forth.
In this article, we’re going to explore the fundamentals around Web Vitals, what they are, and how you can use them to create a great user experience for your website customers and visitors.
What are Web Vitals?
Google knows almost every website on the Internet. To accomplish this feat, the search giant relies on its vast army robots to scan the web daily. To rank the websites it uncovers, Google uses its famous algorithms (which update frequently) to look for key factors such as website responsiveness, safety, performance, relevancy to topics, User Experience (UX), and more.
To help web developers create the best web experience possible, Google introduced Web Vitals. Web Vitals are an initiative to help developers worldwide understand what their websites need to be considered a “good website” by Google.
One of the best ways to understand how Web Vitals works is by using it. One great tool to help you achieve Google’s idea of a great website is known as Lighthouse. Lighthouse is Google’s open-source, automated browser extension tool that embraces Web Vitals and displays a website’s data in a helpful way.
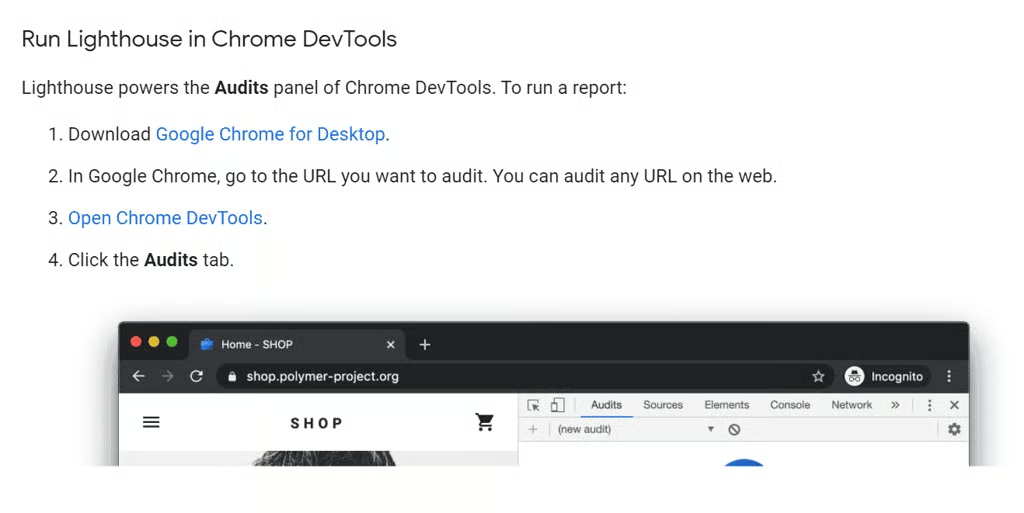
To install Lighthouse, you will need to use the Chrome browser and follow these steps from Google’s Lighthouse installation page:
Let’s use the Amazon homepage as an example. Once you install Lighthouse, you may see a new icon on the top bar of your browser; click the icon, and the following floating window will appear:
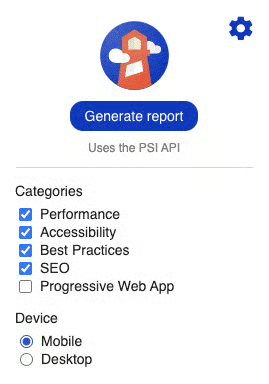
The Options panel shows up once you click the gear button at the top. Next, click the Generate Report button, and a new tab will open. Wait until it finishes processing, similar to the image shown below:
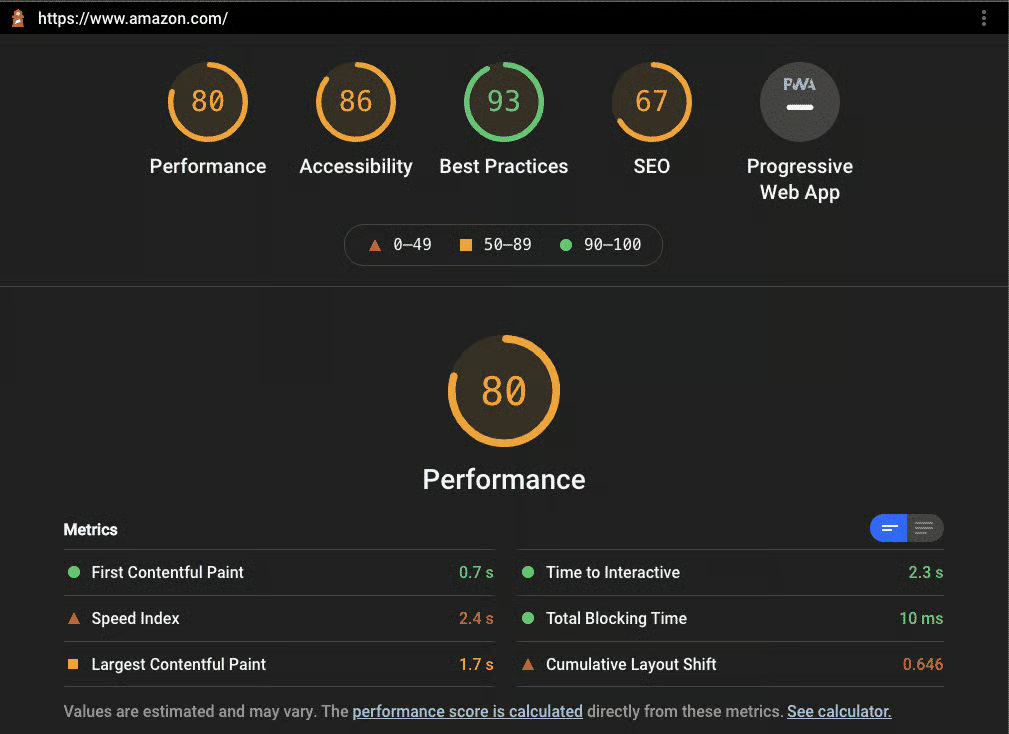
Amazon’s performance metrics
You will see five main sections on the top of the page, each corresponding to Lighthouse’s core analysis of Amazon’s adherence to Web Vitals.
Lighthouse grades of the five metrics on a scale ranging from 0 to 100, splitting them into three major categories with colors serving as labels of severity.
The first section displayed is Performance. Web Vitals analyzes a bunch of different factors to calculate these scores, among which include:
- LCP – Largest Contentful Paint: This measures specifically the time it takes for the main content of the page to be painted on the screen so that the users don’t wait too long to see something. Usually, a good value for this metric would be below 2.5 seconds. If it takes longer, Google will penalize your score.
- FID – First Input Delay: Once you define how long it takes for the main portion of your page to load, it’s time to measure how long it takes for a user to be able to interact with it. That’s a test not many developers make; however, they should, since elements appearing but not being able to interact with them until the page fully loads is not considered a good thing by Google. A good value here usually floats around 100ms or less.
- CLS – Cumulative Layout Shift: This metric checks how many elements in your page shift around while loading. If you load your components as the page load goes by and they shift too much during the process, Google will reduce your scores.
- TTFB – Time to First Byte: How long does it take for the browser to receive the first byte of your page? It’s ok to pre-digest things on the backend before sending it to the frontend; however, be careful with how long this takes.
- FCP – First Contentful Paint: This is another auxiliary metric to help calculate the first portion of a page that shows up on the browser.
- TTI – Time to Interactive: This is used in conjunction with the FID to help Google understand how long interactions take to happen on the browser.
Another great part of this tool is that it gives you a list of problems and possible solutions to fix them. Take a look at the list of issues below for our Amazon example:
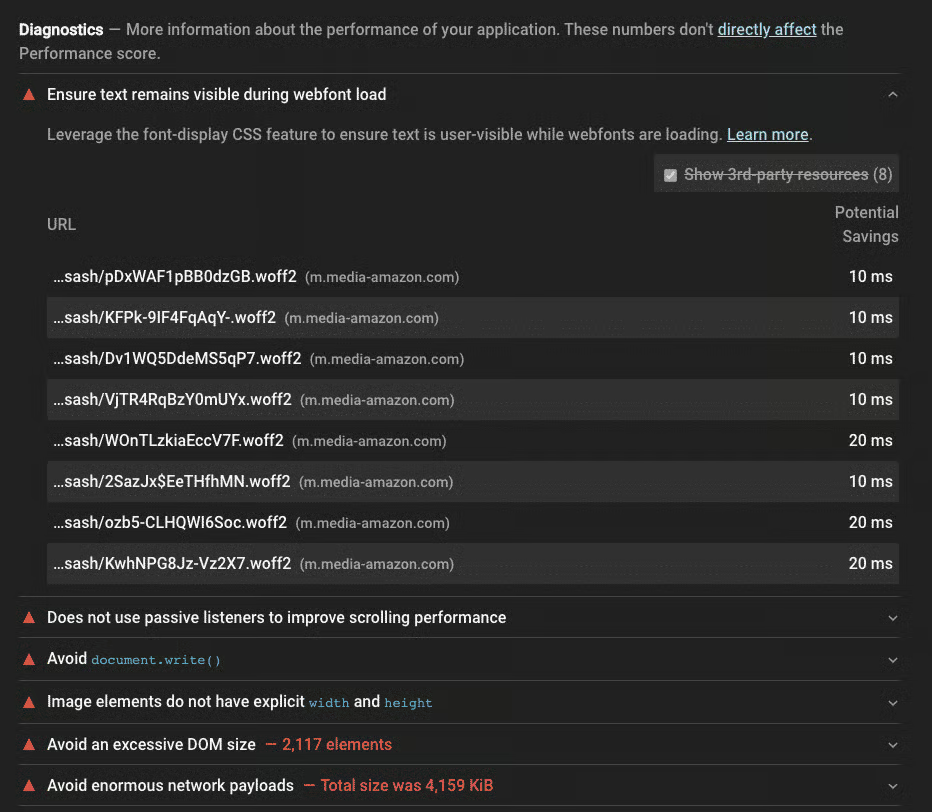
List of diagnostic items
Each problem usually comes with a link to Google’s explanation on why it is a problem and how you can address it.
It also shows the resources, code snippets, or code lines in which Lighthouse found the problem, which helps save you time during the troubleshooting and fixing process.
Additionally, at the end of the report, you may find the runtime settings that the tool used to run it. That’s important to verify the differences between one browser and another or to identify gaps that only a specific version of a browser presents.
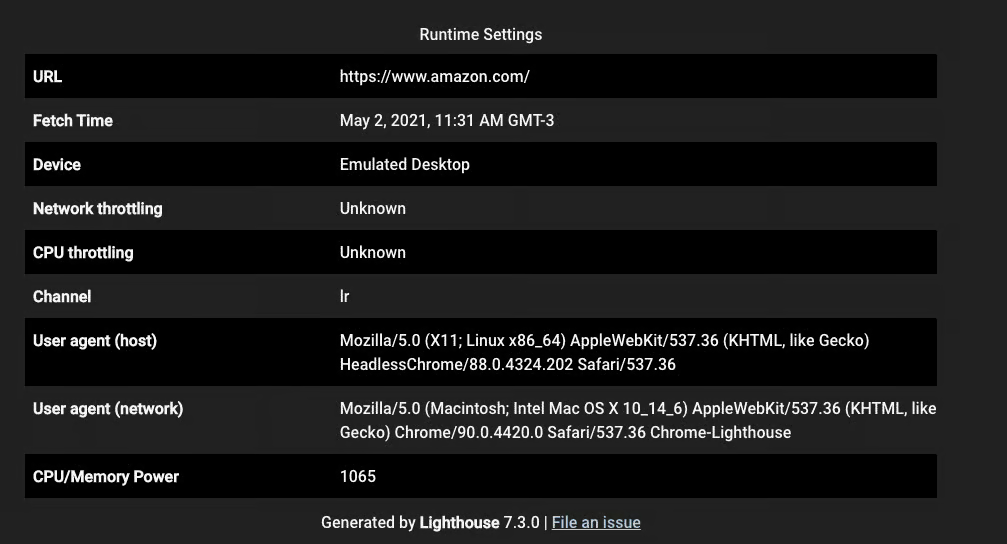
Lighthouse runtime settings
Final Thoughts on Web Vitals and Lighthouse
If you don’t want to install a new browser extension, Google also provides you with a web page to measure the Web Vitals for your website:
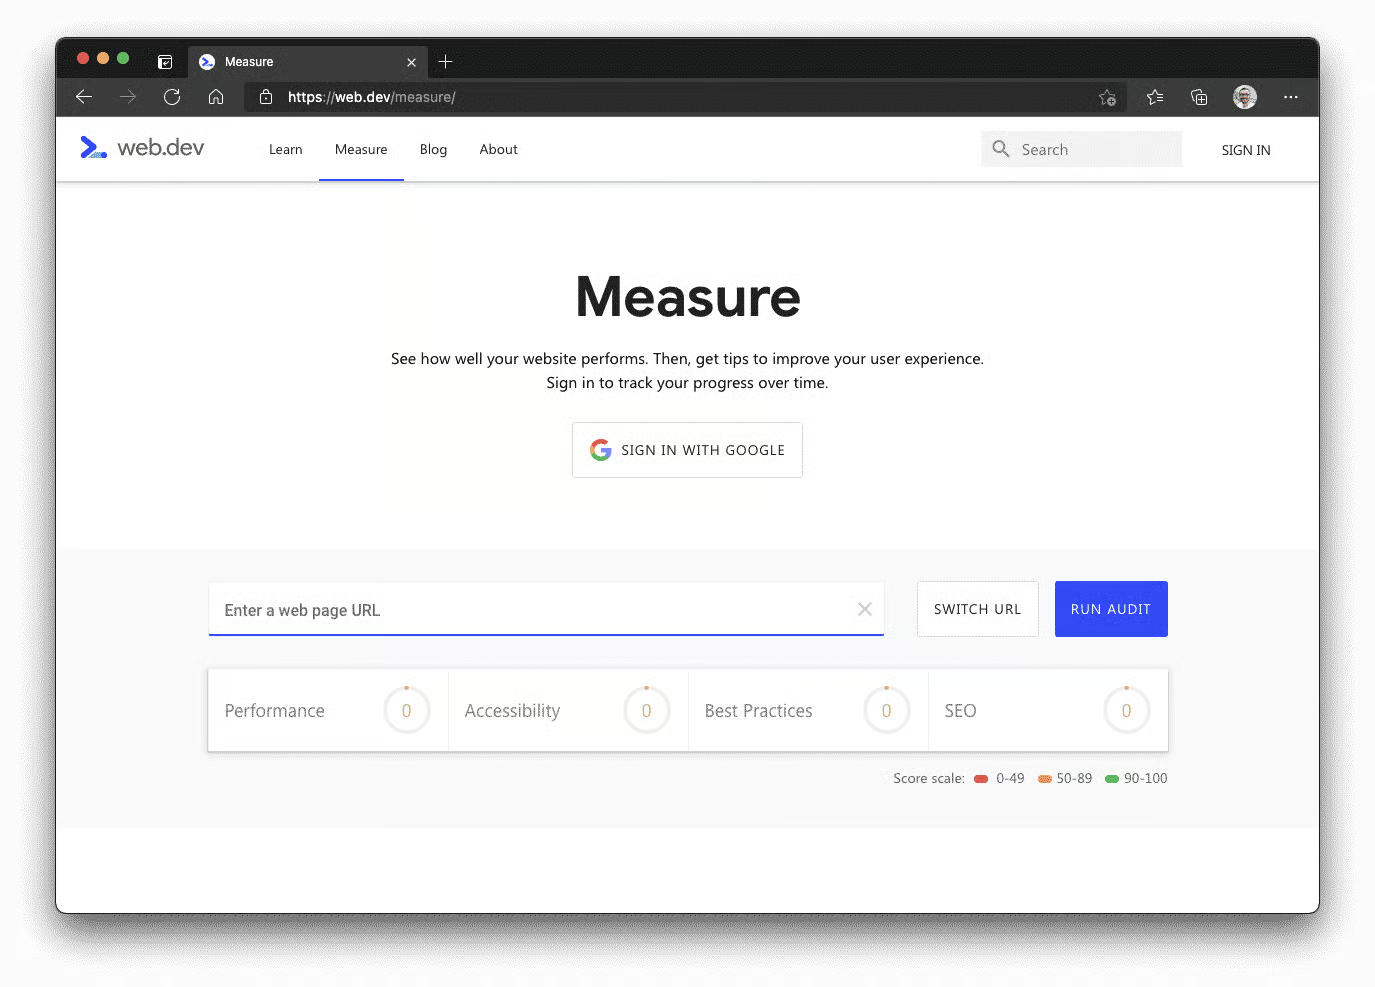
Google web page to measure Web Vitals
I couldn’t stress enough the importance of taking a moment to read over the official docs for much more on what Web Vitals are capable of providing you in terms of web metrics. Good studies!
