


By Justin Whitney
7/8/13
The first article in this series covered the basics of SVG, an overlooked, underappreciated aspect of HTML5. While different browsers implement SVG in different ways, the previous walkthrough described how to create text, incorporate SVG images and build basic shapes such as circles, polygons and paths in a way that all browsers recognize.
The result was the start of quite possibly the world’s first SVG-driven Zombie Apocalypse Survival Predictor. Thus far, the page is pretty (ish) but completely nonfunctional. To take the page to the next level, this walkthrough delves deeper into paths and their myriad uses, demonstrates how to build the prediction meter and touches on some basic animation to add that little extra to the page (for the browsers that can understand it).
The Text Element (Continued)
Take a closer look at SVG text. In Part 1, the
Surviving the Zombie Apocalypse
This example should display correctly in every browser, but it doesn’t even scratch the surface of what sets SVG text apart from regular text.
The transform Attribute
To start, consider the “transform” attribute. Previously, this attribute was used to shrink SVG images to their proper sizes, thusly:
transform=”scale(.10,.10)” xlink:href=”human.svg” />
However, the attribute can also be applied to
This says, “at the coordinates 100,100, rotate the text 30 degrees (clockwise).” The result should look like Figure 1.
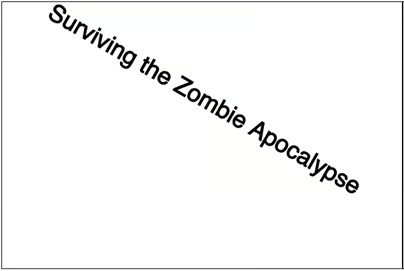
Figure 1. SVG Text Title with transform=”rotate” Applied
The transform attribute includes several other possible values:
· translate: Shifts text vertically or horizontally by the specified amount
· scale: Scales text by the specified vertical and horizontal ratios
· skewX: Skews text along the x-axis by the specified angle
· skewY: Skews text along the y-axis by the specified angle
· matrix: Allows for a custom transformation definition
These transformations apply to other SVG objects as well, as demonstrated by the scale transform. Transforms can also be nested by listing them in the order of the transforms you want. For example, note the result of the following code in Figure 2. Two words in the same position, with the same transformations, but applied in reverse:
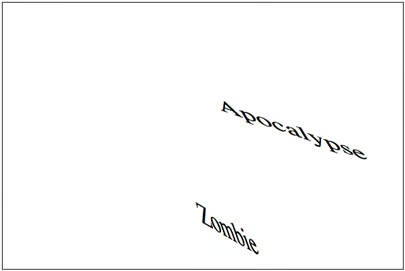
Figure 2. Result of Nested Transforms on SVG Text
For more information, read the W3 spec on the transform attribute.
The tspan Element
In the previous example, two separate
In addition, position can be defined either absolutely (x,y) or relatively (dx,dy). Combined with
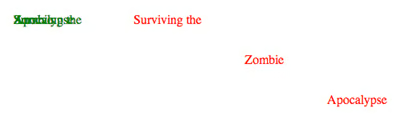
Figure 3. Applying Absolute and Relative Coordinates to
One neat trick that the origin coordinates enable is to specify multiple coordinates, which then get applied to each letter. While this can be done with absolute coordinates, it’s a bit easier with relative coordinates, especially when applied to an individual
![]()
Figure 4. Multiple Relative Y Positions Applied to a
Going back to the original “cityBox” element created in Part 1 of this series, apply the “rotate” transform to the text as a whole, and the multiple relative Y-coordinates to the last word. Now the terrified little human has something to run from, even before adding the zombies, as you can see in Figure 5.
Surviving the Zombie
xlink:href=”human.svg” />
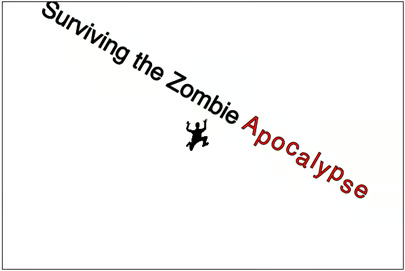
Figure 5. Run Little Human! Run!
The Animate Element, or Introduction to SMIL
Before leaving the title alone in peace, there’s one more interesting trick that can be applied to it for dramatic effect: the
Like SVG, Synchronized Multimedia Integration Language (SMIL) has been around for a while, with v1.0 becoming a W3C Recommendation in 1998. It essentially provides animation markup for text and media. Since the same working group that developed SMIL also worked on aspects of SVG, the latter incorporates certain features defined in the SMIL spec.
To date, not all browsers recognize SVG animation via the SMIL spec. However, those that don’t will simply ignore it rather than break. So consider animation a nice treat for a subset of users. (See “Can I use…” for a complete list of browsers and versions that recognize SMIL animation.)
The primary elements making up SVG animation include
To use SMIL animation, the element should be nested within the SVG element being animated. In this example, the stroke color of the title text will be animated (attributeName). It is set to begin 2 seconds after being loaded, last 10 seconds (dur), and go from black to red. The animation is then set to freeze on its end state by setting fill=”freeze” (not to be confused with fill color).
Surviving the Zombie
If viewed in a compliant browser, this results in a slow, subtle effect suggestive of bleeding text. (Skip to the sample page listed at the end of this walkthrough for a demonstration.)
The Path Element
Part 1 of building the Zombie Apocalypse Survival Predictor covered the basics of creating a
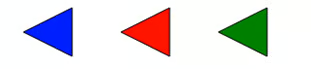
Figure 6.
But Paths can also do much more, from creating simple lines to setting the baseline for text to defining a motion path for animation.
Creating Straight Lines
As shown in the preceding snippet, a line consists of nothing more than the Moveto (M) or starting point and the Lineto (L) or connecting point. The following creates three consecutive lines of varying stroke widths:
These use absolute coordinates to define precise placement of the line nodes. However, relative coordinates can also be used where it makes more sense by using lowercase “l” for Lineto. The following creates an identical set of lines as the above example (and, as a bonus, note how the “style” attribute is replaced with individual attributes so that the stroke color can be set for the entire group instead):
In this case, rather than defining a Lineto coordinate of “175,100”, for example, “l 75 0” says “Draw a line to the right for 75 points.”
If you’re drawing multiple lines of the same style, the relative Moveto (m) can be used the same way by establishing the first origin, then adding new relative origins in the same
is identical to
When you’re drawing vertical or horizontal lines, things get even easier. The Horizontal Lineto (H or h) and Vertical Lineto (V or v) commands reduce the coordinate to a single dimension, either absolute (H or V) or relative (h or v). The following draws the same three lines as the earlier examples (note, too, the elimination of superfluous whitespace between the commands and numbers):
In addition to all the straight lines, paths can create curvy lines. In fact, the
· Quadratic Bézier curve (Q): Draws a curve by specifying a control point and end point
· Smooth quadratic Bézier curveto (T): Smoothly continues a quadratic curve to a new point
· Curveto (C): Draws a cubic Bézier curve by specifying an end point and two control points
· Smooth curveto (S): Smoothly continues a cubic curve to a new point
· Elliptical arc (A): Draws an arc by describing two ellipses and their intersection
Since curved paths are not strictly necessary to escape from zombies, they won’t be covered here. For more information, see the W3C spec on
Creating the Prediction Meter Pane
With
.svgBox {
border: 1px solid #000000;
float: left;
}
Also be sure to add the class to the controlPanelBox
Create a new element of the same class to serve as the container for the prediction meter:
This meter will be pretty basic, consisting of some simple shapes, such as thermometer tics and a pointer that will eventually be repositioned based on the prediction algorithm. It will also include a button that will be made interactive in the last article in this series. For now, add a text label and some groups to contain the other elements:
The oddsText element will be manipulated through JavaScript later to reflect the thoroughly scientific calculation, but in the meantime it will remain static.
With SVG objects, order counts. Since the tics will be on the bottom of the stack, draw those now. Prior to this walkthrough, those lines may have looked something like this:
However, by pulling stroke information into a group element, as well as using relative Movetos and Horizontal Linetos, this code can be reduced:
Beneath the tics but within the oddsMeter group, draw a triangle like the one used in the control panel. Only this time, since it’s a single object and won’t need to be duplicated, use the
This element is contained within the oddsMeter group, so a new stroke width is specified to override the group’s stroke-width attribute.
Last, add a rounded rectangle at the bottom of the same group, which will cause it to appear on the top of the stack. The
Below the meter, add the button for calculating the odds of survival. The button consists of two SVG elements,
The finished prediction meter panel should look like Figure 7.
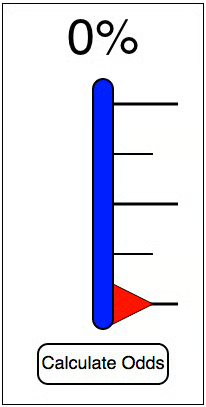
Figure 7. Zombie Apocalypse Survival Prediction Meter
Creating a Text Baseline
As previously mentioned, paths can also provide a baseline for
First add a crooked path at the top of the “cityBox” SVG pane. Go ahead and include a black stroke for now (stroke weight will default to 1). Since this is not a straight line and can be seen as a potential polygon, set fill to “none”. Give it the name “titlePath”, which will be referenced in the next step. By default, if the path is not long enough to serve as a baseline for the entire text, any remaining text will be truncated, so this path is given an extra-long leg at the end: “l250 100”.
The path, without the additional elements, should look like Figure 8.
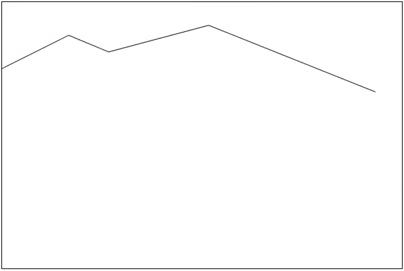
Figure 8. Path for Title Text
To anchor the text to the path, nest the text content and any
Surviving the Zombie
xlink:href=”human.svg” />
Unfortunately, here’s where browser differences poke their ugly, rotting head. Some browsers ignore the “x” attribute and position the text to the baseline according to the “text-anchor” attribute. Other browsers ignore the “text-anchor” attribute and position the text to the baseline according to the “x” attribute. So, to find a fix that works on both, change text-anchor to “left” and x to “15”:
text-anchor=”left” stroke=”#000000″ fill=”#000000″>
The universal result should look something like Figure 9.
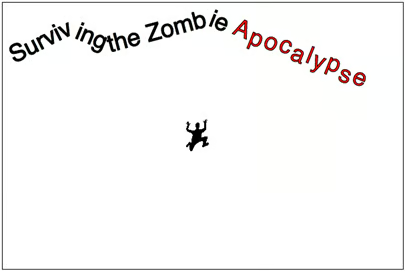
Figure 9. Title Set to Baseline Path
Creating an Animation Path
Though the full potential of the
In Part 1, the control panel pane included a toggle for Zombie Speed, as rendered in Figure 10:
xlink:href=”zombie.svg” />
xlink:href=”zombie.svg” />
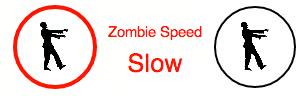
Figure 10. Zombie Speed
To have a little something extra, it would be interesting if those zombies were actually moving around. To do that, two sets of new elements will be added: invisible paths and the
Before making the zombies walk, or rather shamble, it’s helpful to know how animation paths work, since it’s not necessarily intuitive. The key difference between using a
To explore this, create an empty
In this example, the goal is to move the red circle from 100,100 to 300,50. So a path is placed starting at 100,100 and ending at 300,50. To add motion, open up the
When the page is loaded (in an animation-friendly browser), something interesting happens. Instead of moving along the path from 100,100 to 300,50, the circle jumps down to 200,200 and moves to 400,150, which brings it halfway out of the
This is easy enough to work with. For paths used in animation, simply start them at 0,0, the only drawback being that the path becomes a little trickier to develop and debug since, as in this example, it may extend out of the
Now the circle moves as expected relative to its starting origin. In fact, because animation paths define relative movement, the circle can be moved to a different origin entirely and will still move in the same way at its new location, without having to modify any
Now, zombies. First, create the paths that will be used. The goal here is for the zombies to move within the confines of their underlying
In the following revised code for the Zombie Speed toggle, two paths are added with approximately the same number of points. The key difference here is the duration of the
stroke=”none” />
xlink:href=”zombie.svg“ >
xlink:href=”zombie.svg” >
The result: the Zombie Speed toggle gives the user additional visual information about the function of the buttons and what their impact may be. Shamble vs. rage. Romero vs. Snyder. It’s right there on the page.
What’s Next
At this point, all of the basic visuals of the Zombie Apocalypse Survival Predictor are in place, plus a few bells and whistles. The
But quite a bit of work remains to be done. The final part of this series hooks up all of the user interaction. It explores a few different methods of interacting with
The code thus far can be seen in action here.
This article is part of the HTML5 tech series from the Internet Explorer team. Try-out the concepts in this article with 3 months of free BrowserStack cross-browser testing @ http://modern.IE
Justin Whitney is a freelance mobile app developer, Web developer, and filmmaker. While writing this article, he dreamed that he was caught in an infestation of rage zombies infected by toxic turkey dander. Fortunately, he was rescued by The Doctor. He can be reached at webmaster@justinwhitney.com.
This article was reprinted with permission from Microsoft Corporation. This site does business with Microsoft Corporation.
