Today, HTML5 is kind of like a TV series without any future seasons written yet.
It has a some episodes already filmed, some raw material that needs to be edited, some shots that are in line for cool special effects, and many, many rough drafts. Yeah, I`m talking about the whole HTML5 story, not just the spec, but hopefully you got the idea.
I’m going to focus on one interesting scenario that isn’t directly covered by the HTML5 standard, but is in high demand and visually impressive. It’s audio visualization using HTML5 <audio> like this:
In my TV series analogy, audio visualization (specifically low-level API to access an audio stream) falls squarely between early drafts and ideas for future series.
What you can do with <audio>…and what you can`t.
The <audio> element in HTML5, as you already guessed, does not provide low-level API. It does allow you to manage the audio stream playback on a high level: play and pause, set and get current position on the timeline, know total duration, work with text tracks, and control volume level.
If you try to do anything more complex than playing a single music file with <audio>—like synchronizing audio samples—you’ll realize it’s not as easy as you’d like it to be.
There are also limitations around other audio tasks that you might want to implement on your site:
– Support for multiple file formats or codecs like MP3 and H.264
– Browser features for controlling music players
– Browser pre-processing and network testing
As you can see, it depends not only on the spec itself, but also on real implementation in real browsers.
Future standards for audio…maybe
There is an initiative happening to provide the low-level API for audio stream by the Audio Working Group at W3C.
“The audio API will provide methods to read audio samples, write audio data, create sounds, and perform client-side audio processing and synthesis with minimal latency. It will also add programmatic access to the PCM audio stream for low-level manipulation directly in script.”
So, maybe someday in the future, we’ll see a common, standards-based solution for audio stream manipulations.
In the meantime, let’s come back to the real world and dive into what we can do with HTML5 today!
Practical approach: what can I do today?
First of all, what exactly do you need to build a visualization? You need some data that is timely aligned with the audio playback. It could be textual information like lyrics, data representing volume levels, or any other data you want to play with.
Where can you get data? The practical way is preprocessing. Yeah! So simple and trivial…
Basically, you’ll need to do some homework if you want to visualize audio. Analyze your audio stream first, and then you’ll be able to generate a visualization synchronized with the audio playing in the background.
For example, if you want to extract semantically important data (like lyrics for a song), preprocessing is the only possible solution (unless you have enough skilled AI to understand words and sentences in a song).
Usually, it’s a tedious, manual task. You sit down, turn on your audio player, start playing the song, remember a line, pause, write it down, look at the timer, write down current time…and do it again and again. Sometimes, you can just pull it from the Internet somewhere. J
And preprocessing is just plain efficient. Using this approach saves computational resources and consequently reduces the load on the client side. That means that you should compute (or write) your data for audio visualization only once, then just use this data to make your magic happen anytime you want.
Now let’s see how it works in real life…
Dealing with real-world examples
To familiarize yourself with all the great solutions I’ll address in a moment, you can use the developer tools in your favorite browser. Internet Explorer provides great devtools for this purpose (just press F12!). You can use the Scripts panel to look into JavaScript code, debug it, set breakpoints, or run your own code in the console.
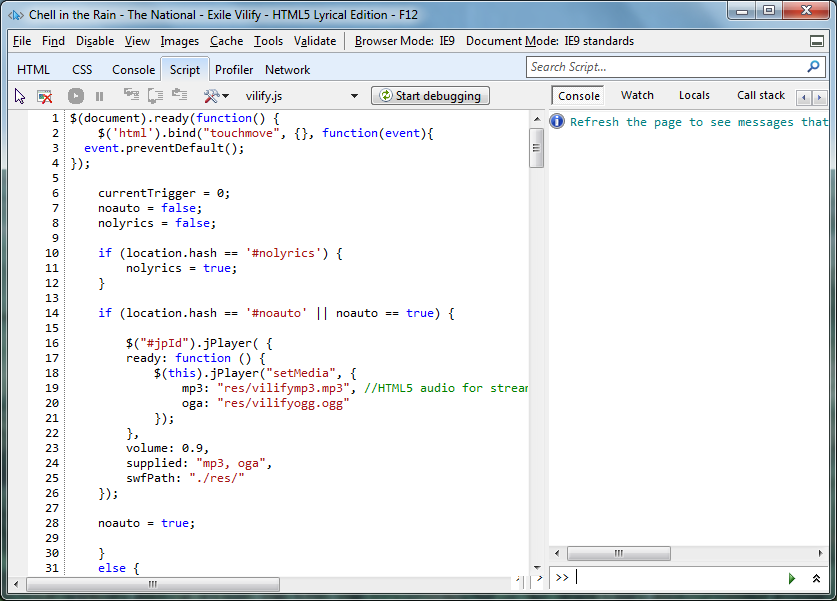
Sometimes you will need to deal with compacted (or minified) code. In that case, just press “Format JavaScript” to make it more readable.
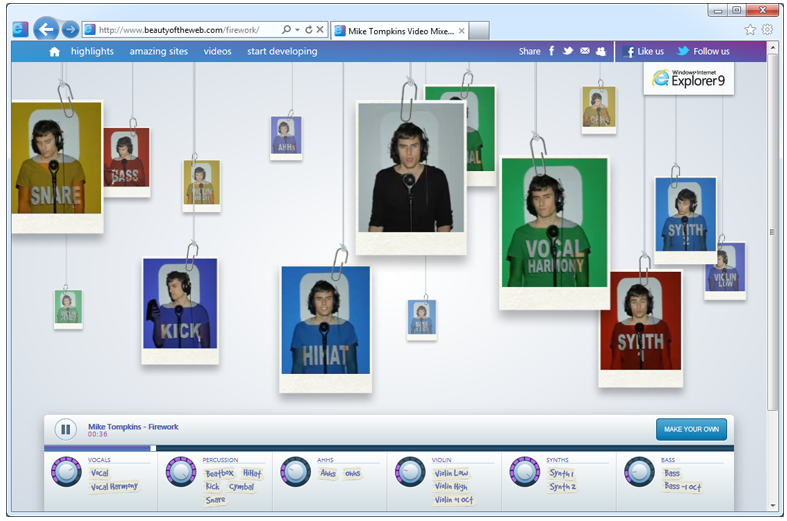
Example #1: Chell in the Rain
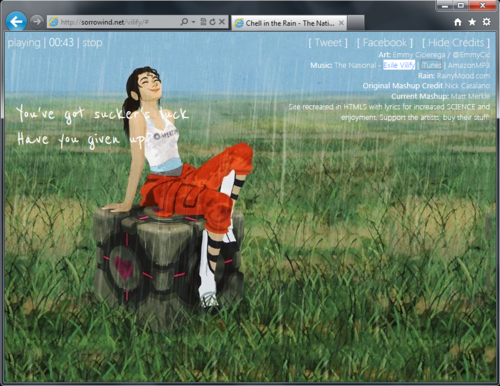
Since HTML5 <audio> doesn’t provide any API to extract low-level data from audio files, Grand wrote a small AIR application (with samples) to help us extract the data on volume levels from an mp3-file, then store it in a text file or an image.
Zoomed in, the volume levels data looks like this:

Now, with this image, we can easily extract all the data we need using HTML5 canvas. (And it is much easier for text files—I`m not showing it as it makes no sense to read it yourself as all the data is compressed.)
To work with this type of preprocessed data, Grant also wrote a small JS-library (VolumeData.js, part of the .zip I downloaded above).
To visualize something, you need to load the data first:
loadMusic(“music.jpg”);
The function loadMusic just loads the image:
function loadMusic(dataImageURL) {
image = new Image();
image.src = dataImageURL;
playing = false;
Ticker.addListener(window);
}
Now you should create a new VolumeData object:
volumeData = new VolumeData(image);
And then on each time update, you can do everything you want using average volume data for current time or separate data for each of the channels (left and right):
var t = audio.currentTime;
var vol = volumeData.getVolume(t);
var avgVol = volumeData.getAverageVolume(t-0.1,t);
var volDelta = volumeData.getVolume(t-0.05);
volDelta.left = vol.left-volDelta.left;
volDelta.right = vol.right-volDelta.right;
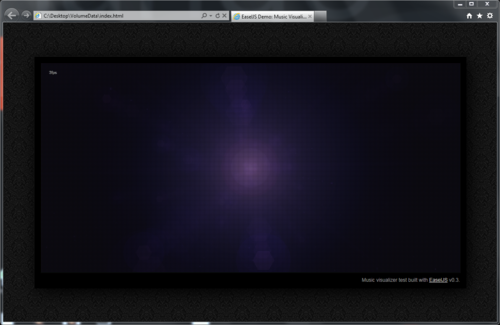
All visual effects are done based on this data. For visualization, Grant is using the EaselJS library. Here are some samples: Star Field and Atomic.
Now you have all the tools you need to make cool audio visualizations! J
To sum up: Use preprocessing to make your solution more efficient. Try combining audio playback with textual data, animations, and graphic effects based on the volume levels data to make compelling user experiences. Make it look like it’s magic!
Additional resources and more information:

This article was reprinted with permission from Microsoft Corporation. This site does business with Microsoft Corporation.