


I recently wrote an article entitled Customizing PlotKit Chart Axes in which I briefly addressed how to set up chart axes to accommodate negative dataset values. While PlotKit can certainly work with negative values, I found that bar charts did not manifest themselves as expected. Instead of originating at the zero Y axis point, the bars all rose from the lowest axis value. Curious to find out more, I did some digging to find out whether I was out to lunch, or the PlotKit bar charts were limited in that aspect. I discovered that the chart type that I had in mind was not your typical bar chart, but more of a “win/loss” type. Although the “win/loss” chart type is not supported by PlotKit, I managed to add the new type with only a few code tweaks, which I will describe here today. This article will focus on the changes to the Layout.js and Canvas.js files, while the next one will cover the SweetCanvas.js file.
The Win/Loss Chart in a Nutshell
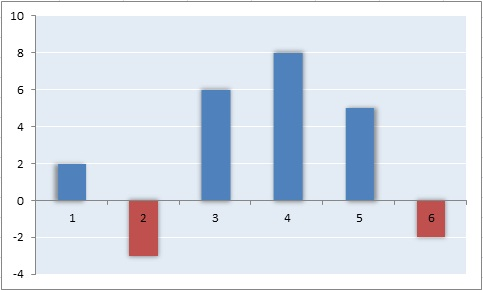
Technically, a Win/Loss chart is one in which the value of each column is either 1 or -1, where 1 denotes a win and -1 a loss. In fact, the bar chart that I envisioned was more of what you might call a positive & negative bar chart, whereby all bars extend from the zero axis. Nonetheless, I stuck with my name because “win/loss” is a little more succinct than “positive/negative” and just as descriptive. You may call yours whatever strikes your fancy.
As alluded to above, there are three files that we’ll have to modify to include our new chart: Layout.js, Canvas.js, and SweetCanvas.js. All three can be found in the PlotKit folder of the PlotKit installation. You might want to make backups before tinkering with the library code. Also, note that changing the source code as we are doing here may have repercussions down the line, because you’ll have to reintroduce the changes if and when you upgrade to a newer release of the PlotKit library. Configuring the changes as a patch-type implementation may alleviate some of this burden.
The Layout.js File
On line 45 there is an array literal containing the valid chart styles. We should include our chart in there although there is currently no enforcing of types.
//change this
PlotKit.Layout.valid_styles=["bar","line","pie","point","lineonly"];
//to this
PlotKit.Layout.valid_styles=["bar","line","pie","point","lineonly", "win/loss"];
Further on in the code, the evaluate() method contains an if statement in that checks the chart type in order to call the correct delegate evaluator methods. We will include calls to our own functions there.
PlotKit.Layout.prototype.evaluate = function() {
    this._evaluateLimits();
    this._evaluateScales();

    if (this.style == "win/loss") {
        this._evaluateWinLossCharts();
        this._evaluateWinLossTicks();
    } else if (this.style == "bar") {
    ...
The _evaluateWinLossCharts() Method
This method is not that different from the _evaluateBarCharts() method, except for the innermost loop, where it sets the properties of the rect object. Unlike the _evaluateBarCharts() method, ours is concerned with the value of the second array element (referred to as item1). It’s used to differenciate the “win” (positive) bars from the “loss” (negative) ones. Zero values are ignored so that no bar is drawn for those:
// add all the rects
this.bars = new Array();
var i = 0, setName;
for (setName in this.datasets) {
    var dataset = this.datasets[setName];
    if (PlotKit.Base.isFuncLike(dataset)) continue;
    for (var j = 0; j < dataset.length; j++) {
        var item  = dataset[j];
        var item0 = parseFloat(item[0]);
        var item1 = parseFloat(item[1]);
        if (item1 != 0) {
          var rect = {
              x: ((item0 - this.minxval) * this.xscale) + (i * barWidthForSet) + barMargin,
              y: 0,
              w: barWidthForSet,
              h: 0,
              xval: item0,
              yval: item1
          };
          if (item1 < 0) {
              rect.y = 1.0 + this.minyval * this.yscale;
              rect.h = (-(this.minyval) * this.yscale) - ( (item1 - this.minyval) * this.yscale);
              rect.name = 'loss';
          } else {
              rect.y = 1.0 - ((item1 - this.minyval) * this.yscale);
              rect.h = ((item1 - this.minyval) * this.yscale) - (-(this.minyval) * this.yscale);
              rect.name = 'win';
          };
          if ((rect.x >= 0.0) && (rect.x <= 1.0) &&
              (rect.y >= 0.0) && (rect.y <= 1.0)) {
              this.bars.push(rect);
          }
        }
    }
    i++;
The _evaluateWinLossTicks() Method
The _evaluateWinLossTicks() method is actually just a subset of _evaluateBarTicks() without the horizontal bar code:
PlotKit.Layout.prototype._evaluateWinLossTicks = function() {
    this._evaluateLineTicks();
    var centerInBar = function(tick) {
        return [tick[0] + (this.minxdelta * this.xscale)/2, tick[1]];
    };
    this.xticks = MochiKit.Base.map(bind(centerInBar, this), this.xticks);
};
The Canvas.js File
The render() Method
The render() method is handles the drawing of the chart elements, including the background, axes, and datasets. Hence, we need to append code to handle our chart type. The axes are the same as those of regular bar charts so we can reuse the _renderBarAxis() method:
  if (this.options.drawBackground)
      this._renderBackground();

  if (this.layout.style == "win/loss") {
      this._renderWinLossChart();
      this._renderBarAxis();
  }
  else if (this.layout.style == "bar") {
  ...
Here are the three files that we covered here today. For a working demo visit my Stock Strategies Analysis Tool page. Enter a stock ticker symbol and options into the form, click the “Get Results” button, and scroll down to the bottom of the page to see the chart.
In the next instalment, we’ll move on to the SweetCanvas.js file and I’ll show you how to dynamically calculate your own yTicks for more complex win/loss charts.