

Pucker up, Web developers. You will want to kiss Bill Gates on the lips for this one.
I recently stumbled upon the Internet Explorer Web Developer Toolbar, which bears a release date of 5/9/2007, and we’ve been happy together ever since. It is the kind of tool that likely was birthed from a Web developer’s a-ha moment followed by the thought “It’s so obvious. Why didn’t I think of it sooner.”
Oh, sure, a 100% standards compliant browser would be even better, but this little gem will help developers – from beginner to advanced — navigate the still turbulent waters of structural markup.
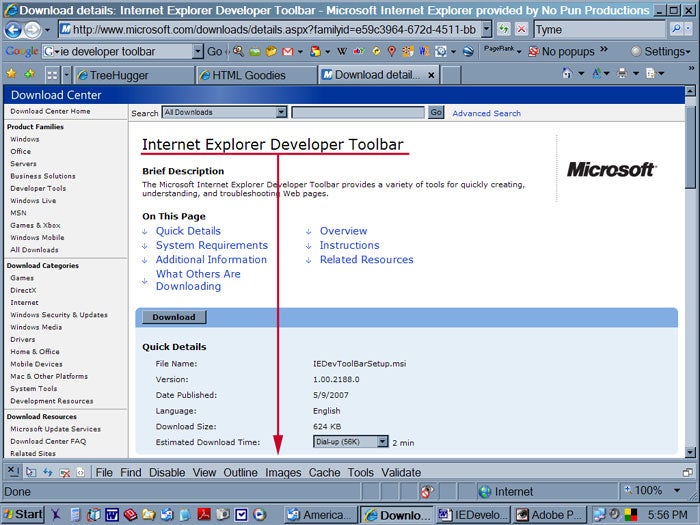
This lightweight (only 624 KB) add-on by Microsoft pins unobtrusively and compactly above the taskbar (as shown above), or can be floated on demand, or hidden completely. Simply slide the top resize bar to see detail, when applicable.
The toolbar features will apply to whatever Web page is in the main browser window. It will help you troubleshoot layout issues, fine-tune CSS, analyze the page’s DOM, and validate your work. Sometimes a developer just becomes blurry eyed staring at code and can overlook the obvious. How many times have you spent way too much time in this scenario. Meet your new best friend: Internet Explorer Web Developer Toolbar 1.0.
For beginners, it also serves as a great learning aid. Browse to a favorite Web page and dissect its construction easily with the toolbar features. The graphical nature of the toolbar – color-coded highlighting and bordering, for example – provide a great visual reference, which is accompanied by the associated source code. Moreover, because the tool with deliver the code for one element (or more) at a time, the viewer need not be overwhelmed by scanning through pages and pages of code to find that coded sweet spot.
What’s In It For Me?
The features as described by Microsoft include the following:
- Explore and modify the document object model (DOM) of a Web page.
- Locate and select specific elements on a Web page through a variety of techniques.
- Selectively disable Internet Explorer settings.
- View HTML object class names, ID’s, and details such as link paths, tab index values, and access keys.
- Outline tables, table cells, images, or selected tags.
- Validate HTML, CSS, WAI, and RSS Web feed links.
- Display image dimensions, file sizes, path information, and alternate (ALT) text.
- Immediately resize the browser window to a new resolution.
- Selectively clear the browser cache and saved cookies. Choose from all objects or those associated with a given domain.
- Display a fully featured design ruler to help accurately align and measure objects on your pages.
- Find the style rules used to set specific style values on an element.
- View the formatted and syntax colored source of HTML and CSS.
How Will This Help Me?
FILE: The only option here is Undo All, which will disable your selections. Since you can turn on several features at a time, this is a convenient reset device.
FIND: This option allows you to locate a code block by clicking on a particular section of the displayed Web page or by searching for an element by type, class, id, or name.
When I build a Web site, I assign an id to at least each parent element and a class to every element. It is much easier to do this from the start. Doing so, however, leads to many names to keep in mind.
If an element is not behaving as you expect, click on it and check to be sure that the necessary class has been assigned to it. Expand the toolbar to see the particulars about that element.
DISABLE: Straight forward, this option allows to you turn off Script, Popup Blocker, or All CSS. Hmmm. I guess that this feature is for illustrating just how bland the Worldwide Web would be without CSS.
VIEW: With the View feature, you can analyze source:
You also can view:
Source code is formatted with indents and syntax color code for easy review.
When invoked, Viewing Class and Id Information, Link Paths, Tab Indexes, and Access Keys appear as highlighted blocks on the displayed Web page in your browser. You can show one or more at a time; each appears in a different color for easier differentiation. Hover over the highlighted reference point to read the detail in tool tip.
Expand the toolbar area, by dragging the resize bar upward, to see the guts and the glory for things as the DOM information. Reports, such as CSS Selector Matches, will open in a popup window, while Link Report will open in your default Web editor as an XML file. This is useful for sitemap creation.
OUTLINE: The Outline feature is chocked full of troubleshooting goodness, and is one of the go-to features. No more setting an element border in your stylesheet — only to have to undo — to debug layout issues. From the Outline menu, select an element to be outlined, and it will be so. Choose from preset menu options or add your own element with a color of your choice. As with other toolbar features, color-coding is used to differentiate the element types, and you can show as many or as few at once as you would like.
The tool is perfect for sorting out DIV issues, and especially useful when working with floated elements that can give you puzzling results. Internet Explorer Developer Toolbar is worth the download just for this handy tool.
IMAGES: This feature tells you everything that you want to know about the images on the viewed page:
I find the quick reference of image size particularly convenient.
The Alt Text viewing is a great overview of how well you have incorporated keywords into your alt attributes. You are incorporating keywords in your alt attributes, right?
The View Image Report option generates an XML file listing all the images on the page.
CACHE: The Cache feature is sexier than you might think. It includes the following handy options:
Love the many options here, especially Always Refresh From Server – the most accurate way to view your revisions. The selective cache clearing gives the developer control over the domain, while leaving other open sites intact.
TOOLS: There are a few options here that warrant a couple more layers of lip balm, namely Show Color Picker and Show Ruler.
So, there you are loitering around Treehugger.com when you realize that their green is exactly the green you want for your new Web site. No worries. Faster than you can pick your nose, you can pick the color (identified by both RGB and hex code values) using the eyedropper. You can even copy it for pasting into your stylesheet or Photoshop color selector.
Show Ruler is a great tool for determining absolute positioning values, for example. Perhaps you have just started laying out your page and you have the masthead in place. You want to position your next element from the top, but how many pixels would you need? Just whip out your Show Ruler option and map the distance. This option has several other components, each of which can be color-coded so that you can easily use them in multiples:
The Tools feature also offers browser window Resize with preset values as well as a custom option. Admittedly, this option does not seem to work well. But, hello, Color Picker!
VALIDATE: No surprise what this feature offers. The menu options link off to known validators and include:
I give the Internet Explorer Developer Toolbar a Pucker-Up Rating of 10. What are you waiting for? Start downloading!
Next week, learn about a similar tool for Firefox called the Firefox Web Developers Extension.
