In previous articles, “Must-Have: Internet Explorer Web Developer Toolbar” and “Firefox Web Developer Extension is Pederrifick”, I introduced readers to a couple browser add-ons for web design. In this article, I will herald another Firefox extension, Firebug.
Geared more for getting at the code (HTML, CSS, DOM, Javascript), Firebug is a no-nonsense tool that does just what it needs to without overkill features. Once installed, it is conveniently available on-demand through the Firefox menubar under Tools, where it can be pinned to the bottom of the browser window and resized at will, or opened in its own window. The hierarchical (indented) display of code, understated color coding of elements, and side-by-side code review panels make it very quick and easy to analyze the guts of any Web page.
If you are developing or theming for a content management system (CMS) — such as Drupal, Joomla, WordPress, Blogspot — Firebug is an essential tool. These applications are comprised of many, many files, and navigating through this maze can be daunting without a tool like Firebug. The beauty of content management systems is that you need not be a programmer to brand (“theme”) a Web site built with one, and typically can do so without ever touching the programming code. But, you must be able to identify the controlling CSS to bring your own vision to the screen.
Key Features
APP SETTINGS
Click the Firebug icon on the menubar to access global settings, as well as links to documentation. A few noteworthy menu options here are:
- Open with Editor: Lets you configure external editors to use with Firebug.
- Text Size: Adjustment of displayed code text size.
- Options:
- Always Open In New Window: Set Firebug behavior. Unchecked will result Firebug being pinned to bottom of browser window/tab. Each browser window/tab is set independently.
- Show Preview Tooltips: Who doesn’t love mouseover tips!
- Shade Box Model: Will highlight/shade a specific area of the viewed Web page when you mouse over the corresponding element within the code review panel.

Firebug has two main modes: INSPECT and EDIT.
INSPECT (HTML)
This is the go-to feature for deconstructing those CMS themes, and you will wonder how you ever got along without it.
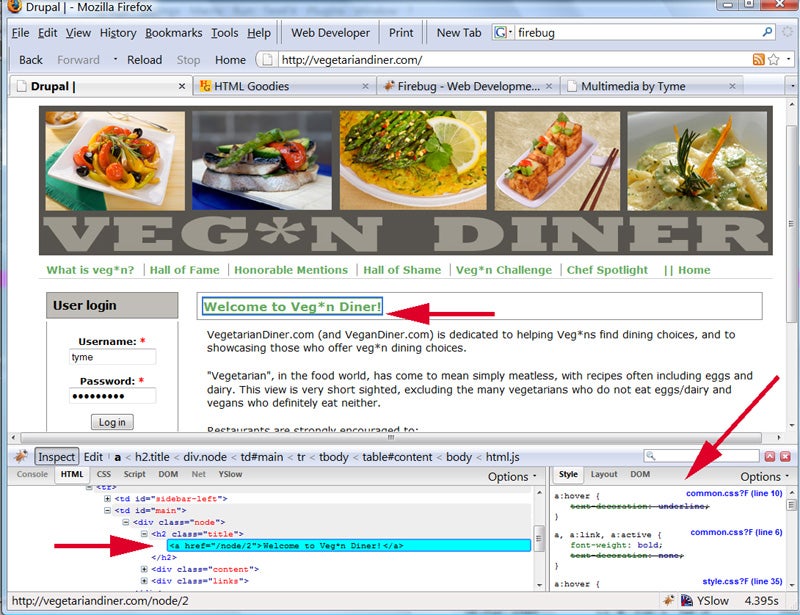
Click the INSPECT menu option to activate this feature. Once activated, move your mouse over an area of the viewed Web page. Click your right mouse button once to lock in that position.

As shown in the screenshot above, the area of the viewed Web page will be bordered; the HTML code corresponding to that area will appear in the left code review panel with the specific tag highlighted; and the corresponding CSS will be shown in the right code review panel. (Note the +/- signs beside HTML containers that allow you to view more or less code, on demand.) Click the DOM tab of the right panel to see any associated DOM code (e.g., Javascript) at play with that section of the viewed Web page.

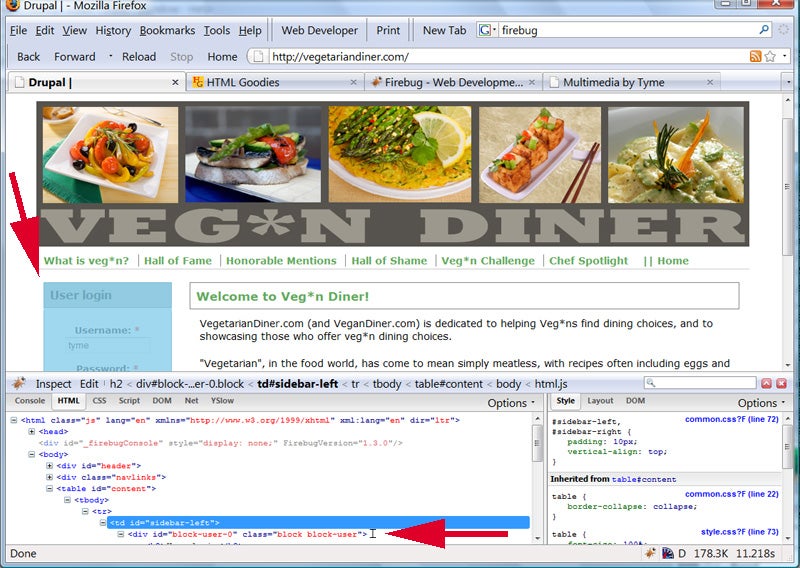
Alternatively, you can move your mouse cursor over a line of code in the left review panel to shade/highlight that HTML container in the Web page, as shown in screenshot above.
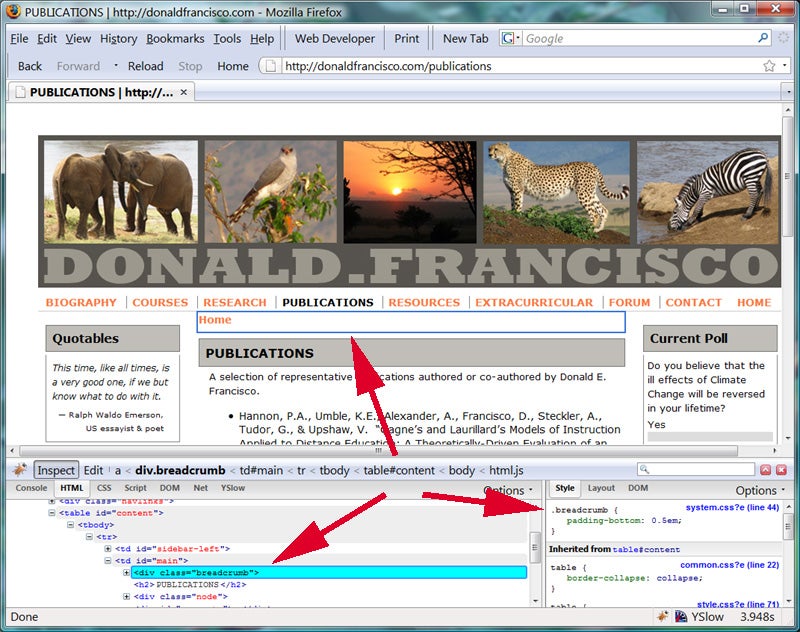
Here is a great example of a practical use of Firebug. Drupal users often ask about turning off breadcrumbs. While current versions of Drupal will allow you to disable them for the front page (through administrator control), the pesky “Home” button remains on subpages — throwing off the layout, as shown in the screenshot below.

The Drupal forums will offer such suggestion as hacking the PHP to rid your pages of this link. No need. Simply deploy Firebug to help you identify the class for this container, and modify the CSS in your custom theme’s style.css. Add the .breadcrumb class to this CSS file*, employing either the display:none or visibility:hidden property, depending upon your specific layout goal.
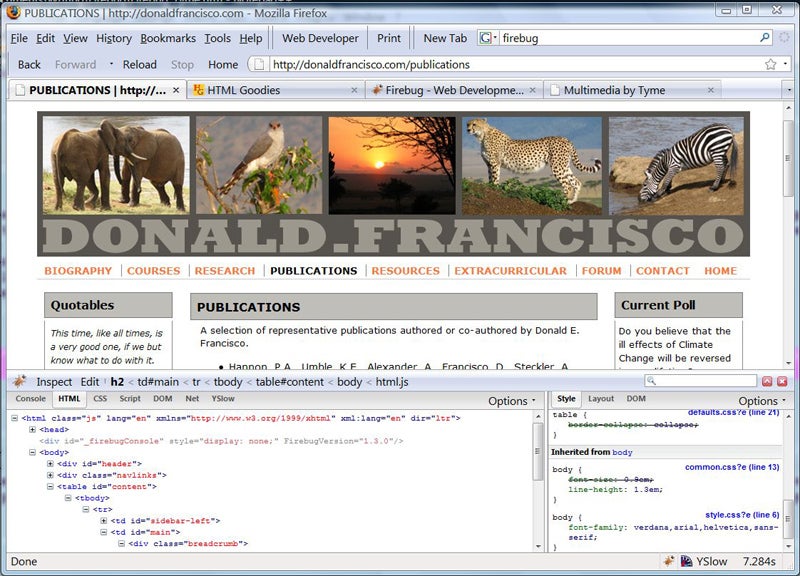
In the above screenshot example, I used visibility (shown below), as I wanted to preserve the white space, with a bit of added control for pixel-perfect box alignment.
.breadcrumb {
visibility:hidden;
line-height:2px;
}

* In CMS applications, you want to avoid modifying the core files directly, such as the system.css file, in this case. But, you can modify the CSS in your custom styles.css file, which will take effect after the core stylesheet(s).
Another stand-out feature of Firebug, particularly when working with “layered” stylesheets, is the strike-through notation shown in the right CSS review panel for styles that have been modified. Notice that the CSS panel also shows you all instances of that class and the .css filename in which it appears. This is quite useful, as knowing the original (or previous) value helps you determine the necessary modification.
On this same right panel, you can switch to LAYOUT mode to view a graphical depiction of the CSS box model settings for the HTML container that you have highlighted in the left code review panel. Click the DOM tab to see any DOM scripting (e.g., javascript) associated with that same HTML code block. Use the OPTIONS feature to show more detail in that panel.
INSPECT:SCRIPT
Firebug includes a powerful JavaScript debugger. One of its many options is to pause script execution — setting a break point at any line, and investigate each variable or object at any given moment. Nice!
INSPECT:CSS and INSPECT:DOM
Because these features are so similiar to the information shown in the right review panel when in HTML mode, I will leave these features to your own exploration.
INSPECT:NET and INSPECT:YSLOW
YSlow is an interesting Firebug add-on. With this feature activated, Firebug will report on the performance of your Web page, offering a breakdown of specific points of concern and tips for optimization. It is similar to the built-in INSPECT:NET feature, which allows monitoring of server activity and individual file load times. When theming a CMS-generated site, you won’t have much control over these issues, but for your own developed Web sites, the information will be helpful.
EDIT
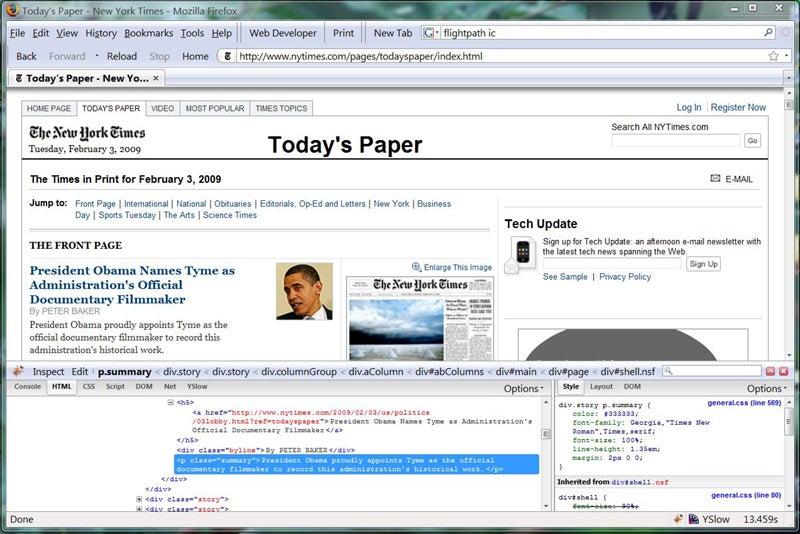
Whenever Firebug is deployed for a particular Web page, it creates a local “working temporary” Web page that you can edit on the fly (even someone else’s!). Activate the edit mode by clicking the EDIT button on the menubar. Simply edit the code (HTML, CSS) in the Firebug review panels to see the immediate effect of that change. Remember, you are in a preview mode. You must edit the actual file for permanent change.

Woo hoo! I made The New York Times lead story! Now that’s change I can believe in.
This introduction has provided a mere cursory glance at the benefits of this Firefox extension. While Firebug is a particularly useful analytical tool for demystifying CMS builds, it also is a great, unobtrusive debugging device for any Web development project. Did I mention that it’s free!
Tyme is a freelance writer and multimedia specialist of many years. She likes walks in the park, cotton candy, and baby ducks. To learn more: www.MultimediaByTyme.com.


