


A few weeks ago, a customer asked us if newer versions of WordPress had improved performance. Surprisingly, we found there isn’t much literature on this topic. Thinking about it, this makes sense because the performance of WordPress is very dependent on multiple variables — such as themes and plugins — and also by the volume of content hosted on the site. Our curiosity now piqued, we decided to check on how WordPress’ core performance changes between releases. The idea is to first set up a basic WordPress install of an official release, with only one post, the default theme, and the plugin sets distributed with that release. We’d then run a very basic set of stress tests against that machine, collect the results, and do it again with another WordPress release.
Setting up the Experiment
We designed the experiment to be repeatable by others — all scripts and tools are open source and can be run independently from DreamHost products. There are three main components:
- A script to deploy a specific WordPress version
- A module that stress-tests WordPress
- The modules used for collecting data and plotting results
WordPress Deployment
In order to have a repeatable base environment for the WordPress deployment, we opted to use DreamCompute. Using Ansible and the OpenStack shade library, we wrote a simple Ansible playbook that creates a Ubuntu virtual machine, installs the LAMP stack, and deploys a specific version of WordPress. After running the playbook, we now have a very basic WordPress site. The sites are setup with the default theme for the version of WordPress being installed, with default posts that are created with the install, and with no caching. This step doesn’t necessarily require DreamCompute and could also be done on a shared hosting account or a VPS; all that’s needed for this first part of the experiment is a way to install WordPress from the release archives.
WordPress Testing
After setting up two test sites — one running WordPress 4.6.6 and another with version 4.7.5 — we performed http load tests against them. Autobench turned out to be a good tool. It’s simple to set up and powerful for generating load (and collecting data). We configured Autobench as shown on this gist after a few trials to identify where the performance plateaued. This is the point where the data gets the most interesting, as it could now show whether the different versions plateau at the same number of requests, and how they differ when they plateau. If you generate too much load, the statistics you grab are not all that meaningful because, at that point, your site could be taking seconds to load and might as well be down. With too little load you might not see where the performance differs, such as being able to handle more requests.
Data Collection and Presentation
Finally, we collected data from the servers and the WordPress versions. The server resource statistics are collected and presented in graphs by Zabbix. These turned out to be less useful than we originally hoped, with all of our tests looking basically identical as far as the resources being consumed. The site response time and performance statistics are collected by Autobench and dumped to a file, then Google Sheets can be used to take the statistics from the file and generate a graph.
The Results
The first tests we did were against the two sites using WordPress 4.6.6 and WordPress 4.7.5; both were running PHP 7.
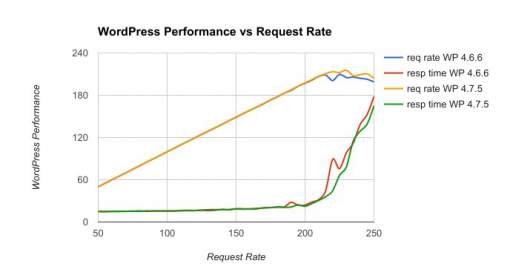 The x-axis indicates the number of requests per second being made by Autobench, and the y-axis shows the number of requests WordPress is able to respond to per second, as well as the response time in milliseconds. Once we get to approximately 200 requests per second, the number of requests WordPress is able to respond to plateaus, as shown by the blue and purple lines. This means that WordPress is unable to serve more clients efficiently. At the same point, response time also grows, but it increases a bit quicker for WordPress 4.6 than it does for WordPress 4.7. This difference is small, but with 250 req/s the response time for WordPress 4.6 is approximately 8% slower than 4.7. Next, we tested different PHP versions. We ran WordPress 4.6 with PHP 5.6, and WordPress 4.7 with PHP7 since that was the first to recommend PHP 7. Below is the graph of WordPress 4.6 with PHP 5.6 vs WordPress 4.7 with PHP 7.
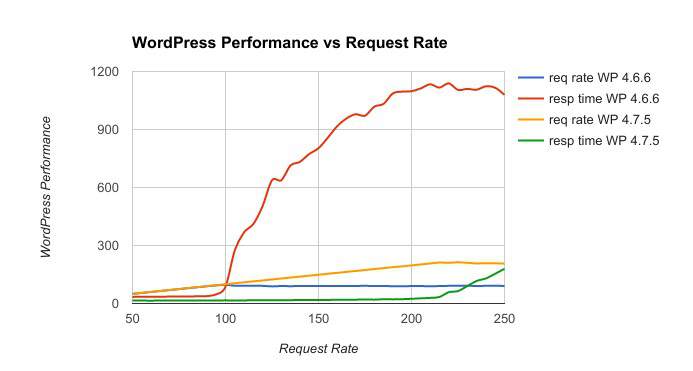 Here, The difference is night and day. PHP 7 clearly outperforms PHP 5.6; this shows just how important the move from PHP 5.6 to PHP 7 was. With PHP 7, WordPress is able to handle approximately 2x as many requests as it can when using PHP 5.6. and the response time is also lower – about 2x as fast.
Conclusions
We were surprised to see that there are negligible differences in the servers running the two WordPress versions (no visible impact on CPU or RAM). The difference between performance in WordPress 4.6 and 4.7 on PHP 7 is small but noticeable. The much more interesting performance gains are from the move to PHP 7. One thing that we did not test, but hope to in the future, is the performance of the REST API. WordPress 4.7 is the first to include REST in the WordPress core, so any previous versions would have to use a plugin to have access to the API – and that may skew the results. We hope to continue to see WordPress getting faster and more performant at higher loads. We’d also be interested in seeing any performance testing you have done between different deployments of WordPress.
About the Author
Caleb Boylan is a DevOps Engineer at DreamHost, a web hosting and cloud services provider for WordPress users.
