


Introduction
Bar graphs are not new to the web nor is this the first implementation of bar graphs using only HTML and CSS. Then why should you read this article? Most implementations are built using only HTML and CSS take either of the two following stances:
- support all browsers which means that you are restricted to the lowest common denominator even though majority of your users have modern browsers installed on their machines
- build for modern browsers and direct the complaints from users on old browsers to the Spam folder
Personally. I don’t like either of them. They are both too derogatory towards each other. In this article, I will discuss a technique called progressive enhancement which I prefer over the other two.
Progressive Enhancement
The idea is simple: focus on the essentials – these features should work on all browsers. Any non-essential feature, whose absence will not impact the accessibility or usability of the website, is added in a progressive manner, depending on what the user’s browser supports.
I would like to cite the classic example of rounded corners here. We all know that to get rounded corners to work on browsers that don’t support CSS3, we stick images into the four corners. Now typically that could take upwards of 30 mins to implement and test on all browsers. Changing the radius or color would mean that you need to update the image and maybe tweak the CSS also. In CSS3, you can do all of that in under 5 seconds. Now what if the site didn’t show up with rounded corners on older browsers? Would visitors abandon using the site because of that? Obviously not! It doesn’t affect the accessibility or usability of the site, so it doesn’t need to be there. Progressive enhancement in other words says to give the user what they have paid for, but not more.
Is it the same thing as graceful degradation? No. The line between the two is fine, but significant. With graceful degradation, you build the site to work on modern browsers and then selectively downgrade for older browsers (such as Internet Explorer 6) while in progressive enhancement, you take a more positive approach towards it. It’s a journey from the simple to the complicated rather than the other way round.
Example of Bar Graph
Keeping progressive enhancement in mind, let’s build a bar graph. For the sake of this article, we have decided to support the following browsers: IE6+, Firefox 3+, Safari and Chrome. Below is a screenshot of how the designer wants the graph to appear. We will try and get as close to this on all browsers.
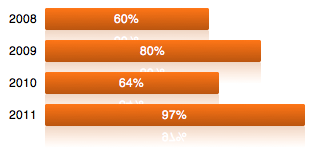
Design for the bar graph.
CSS Markup
The markup, as should be, is very straight. We have used a definition list to represent the graph. For each bar, we use a div with the class ‘bar’ and specify the width in percent.
<
dl style=
”
width: 300px
”
>
<
dt
>
2008
<
/dt
>
<
dd
>
<
div id=
”
data-one
”
class=
”
bar
”
style=
”
width: 60%
”
>
60%
<
/div
>
<
/dd
>
<
dt
>
2009
<
/dt
>
<
dd
>
<
div id=
”
data-two
”
class=
”
bar
”
style=
”
width: 80%
”
>
80%
<
/div
>
<
/dd
>
<
dt
>
2010
<
/dt
>
<
dd
>
<
div id=
”
data-three
”
class=
”
bar
”
style=
”
width: 64%
”
>
64%
<
/div
>
<
/dd
>
<
dt
>
2011
<
/dt
>
<
dd
>
<
div id=
”
data-four
”
class=
”
bar
”
style=
”
width: 97%
”
>
97%
<
/div
>
<
/dd
>
<
/dl
>
To keep the example simple, I have hard-coded the values in the graph, but in reality you might have to get the values from a variable.
CSS Styling
Now comes the interesting part. So if we look closely at the design, we notice that there are several details that older browsers won’t support. Gradient, reflection, rounded corners and one interesting effect that the designer requested for, to animate the graph from 0 to the value.
Progressive enhancement guidelines tell us that none of these details are required, so we don’t need to break our heads to get them to work on older browsers. Below is a screenshot of how the bar graph renders in IE 6 and 7.
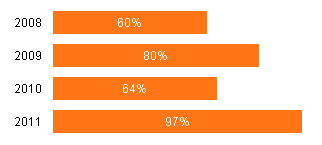
Bar graph in Internet Explorer.
None of the above-mentioned details are visible in IE, but the visual representation of the data is still good enough. We don’t need to use 3 images and loads of Javascript to animate the graph.
Firefox at least supports rounded corners, but it doesn’t understand CSS animations or gradients, so let’s at least display the bar graph with rounded corners. Here is how the graph renders in Firefox.
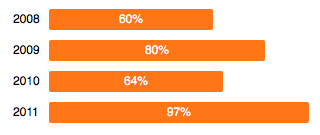
Screenshot from Firefox
Finally, coming to the most advanced browsers (which is what most of our users use), we can see the gradient and the animation too.

Screenshot of bar graph in Safari/Chrome (webkit browsers).
Open the example in various browsers and you will see that in all supported browsers, the content is visible. On browsers that support CSS3, we render the graph in a more appealing style. The best part of this is the code is small, manageable and doesn’t contain any hacks.
CSS Bar Graph Example Code
* { font-family: Helvetica, Arial; font-size: 12px;}
dt { float: left; padding: 4px; }
.bar {
margin-bottom: 10px;
color: #fff;
padding: 4px;
text-align: center;
background: -webkit-gradient(linear, left top, left bottom, from(#ff7617), to(#ba550f));
background-color: #ff7617;
-webkit-box-reflect: below 0 -webkit-gradient(linear, left top, left bottom, from(rgba(0,0,0,0)), to(rgba(0,0,0,0.25)));
-webkit-border-radius: 2px;
-moz-border-radius: 2px;
border-radius: 2px;
-webkit-animation-name:bar;
-webkit-animation-duration:0.5s;
-webkit-animation-iteration-count:1;
-webkit-animation-timing-function:ease-out;
}
#data-one { -webkit-animation-name:bar-one; }
#data-two { -webkit-animation-name:bar-two; }
#data-three { -webkit-animation-name:bar-three; }
#data-four { -webkit-animation-name:bar-four; }
@-webkit-keyframes bar-one {
0% { width:0%; }
100% { width:60%; }
}
@-webkit-keyframes bar-two {
0% { width:0%; }
100% { width:80%; }
}
@-webkit-keyframes bar-three {
0% { width:0%; }
100% { width:64%; }
}
@-webkit-keyframes bar-four {
0% { width:0%; }
100% { width:97%; }
}
