


Script Debugging Using the Internet Explorer Developer Tools
If you’ve done much JavaScript development, you’re probably quite familiar with Firefox’s excellent Firebug tool for debugging your scripts. Microsoft’s Internet Explorer browser has a similar feature called Internet Explorer Developer Tools. It’s purpose it to help debug JScript code, the version of ECMAScript that runs on IE. That’s why code that runs perfectly in Firefox, may or may not encounter problems in IE. In today’s article, I’m going to cover a few of the Developer Tools’ best features and some basics on how to use it to debug your scripts in IE.
An Overview
Like other browser debugging tools, the IE Developer Tools allow you to inspect and debug pages that are local or on a server. The latter is useful when you’d like to figure out how a site accomplishes some scripted task.
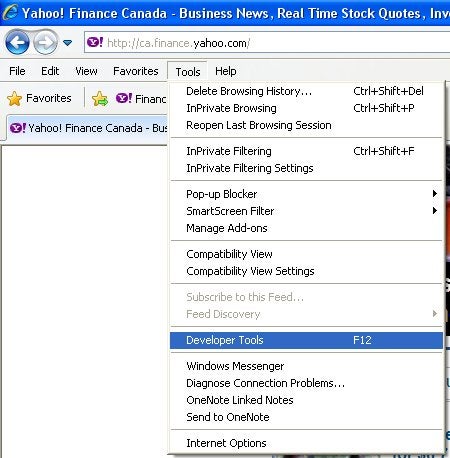
The Developer Tools are accessible from the Tools menu, or via the F12 button:
The Developer Tools appear in their own window by default. However, if you would like to minimize the number of open windows on your desktop, you can pin the tools to the page by clicking the Pin button in the upper-right corner of the tools window or by pressing CTRL+P:
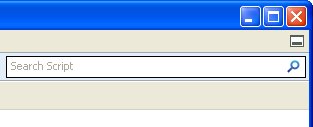
That will place the tools at the bottom of the browser window. You can restore the developer tools to their own window again by clicking the Unpin button.
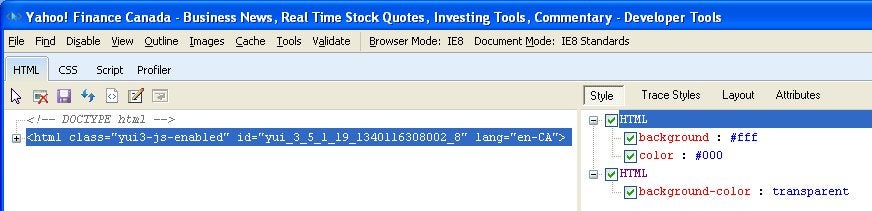
The webpage title appears in the tools window title, to quickly identify what page is being debugged. The window is divided into two main panes. On the left, the source code of the document you are working on is shown. The right pane is actually a collection of stacked panes with attributes that are pertinent to an element of the right pane or more detailed properties such as variables and objects in scripts:
Script Debugging Basics
To select a script to debug, you first have to click on the Script tab:
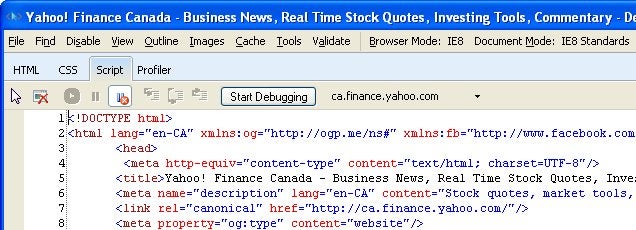
That will display the source of the main HTML page. Other scripts can be selected via the dropdown list on the right of the Start Debugging button:
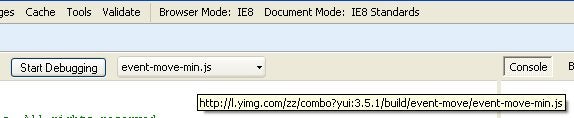
Note that hovering the mouse pointer over the dropdown will display a tooltip with the full path to the file.
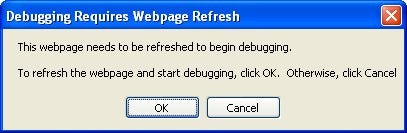
Once you’ve decided which script you’d like to debug, you can run it by clicking the Start Debugging button. If there are no breakpoints assigned, then the script will run straight through as usual. This can be useful to ascertain that the script is working correctly and that no errors are occurring. The first time that you run a script using the Start Debugging button, a warning dialog appears stating that the webpage will need to be refreshed. You can click OK to refresh the page, or Cancel to abort the operation:
Any errors or warnings will appear in the console pane on the right:
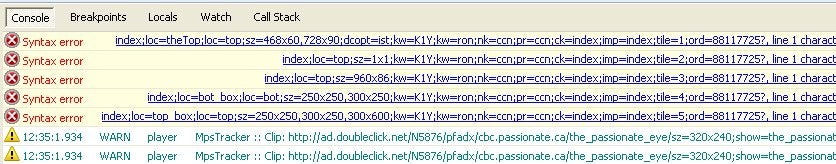
Error messages contain a descriptor – such as “Syntax Error” – and a link made up of the resource name, as well as the line and character number. Clicking the link will bring you to the exact line that causes the warning or error.
By the way, once you’ve clicked the Start Debugging button, any pages visited in the same browser tab will also be debugged, until you click the button again (the button label will have changed to “Stop Debugging”).
Inserting Breakpoints
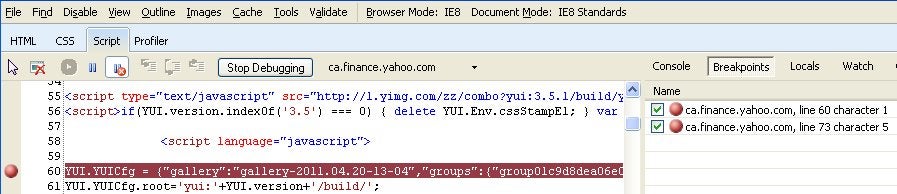
The real debugging happens when you insert breakpoints into the code. It’s simple to do; just locate the exact line you want and click on margin to the left of the line number. A red circle will appear there and the entire line will be highlighted in red as well. Clicking the Breakpoint button will display all selected breakpoints in the right pane:
Every breakpoint can be disabled by unchecking the box to the left of a breakpoint in the list. That will color the circle in white but retaining the red outline. You can also enable and disable all breakpoints at once by right-clicking anywhere in the list pane and selecting Enable/Disable All from the popup menu.
To delete a breakpoint, right-click on the item in the list, and select Delete from the popup menu. Alternatively, you can select the item by clicking on it and hitting the Delete key. There is also an option to Delete All from the popup menu.
To go to the breakpoint in the source code, right-click the item in the list and select Go To Source Code from the popup menu.
Conclusion
In today’s article, we familiarized ourselves with the Internet Explorer Developer Tools and learned some basics on how to run it. In the next installment, we’ll be getting into some slightly more advanced and detailed features such as conditional breakpoints, controlling program execution, and watch expressions.
